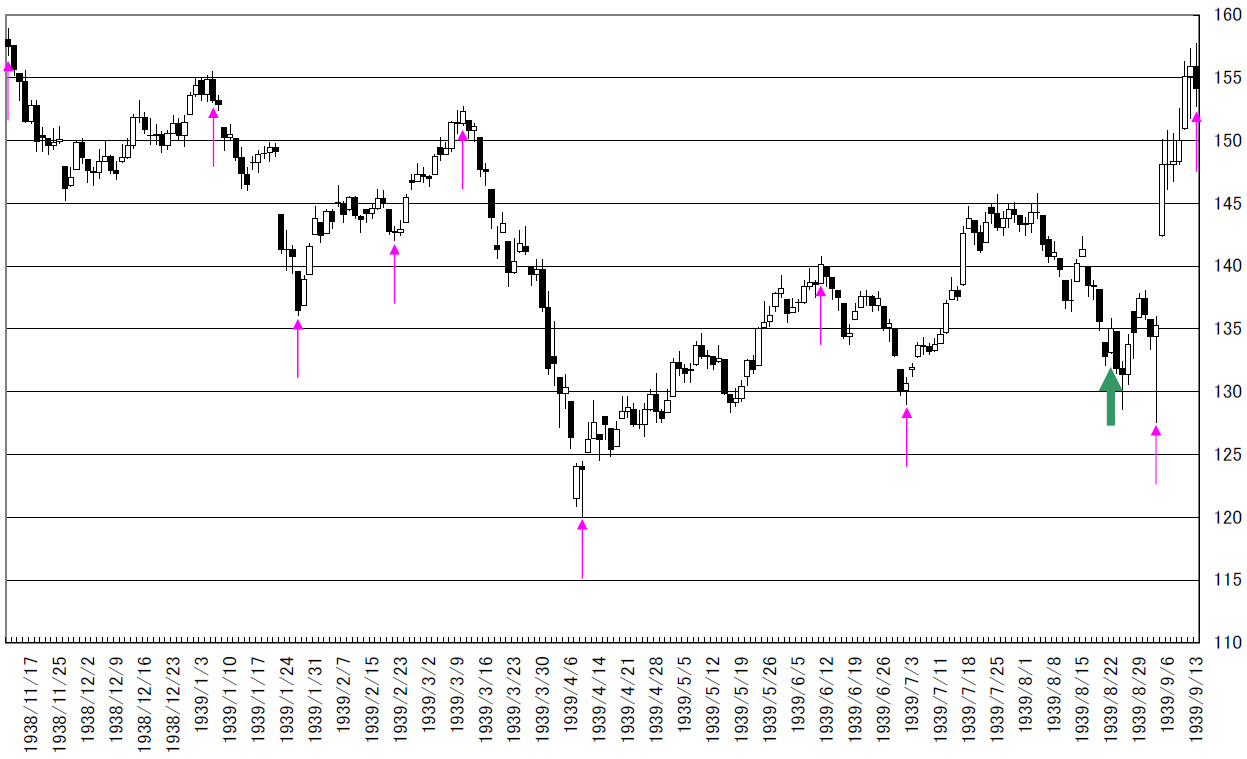
米ダウ工業株日足・やっぱり1938-1939年相場と似ている、週明け変化日か/Dow Jones Industrial Average (^DJI) Daily. We still think the recent market “HIGARA” is similar to 1938-1939 market and next Monday may become a “HENKABI”.

2012/03/01

「定規とろうそく足。」

私たちの分析は伝統的な手段も併用して調査を進めています。

コンピュータだけではわからないことが、いろいろわかります。

“The Ruler and The Chart”

We also use traditional way of analyze.

There is much awareness from these ways.
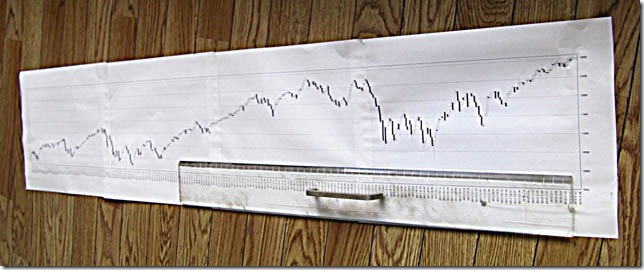
SANYO DIGITAL CAMERA


本日は米ダウ工業株日足についてです。

Today’s analyze is Dow Jones Industrial Average (^DJI) daily.


私たちの2012/02/02のレポートでは、ダウは「2011/05/02から新高値を取れない」ことを根拠に見通しを組み立てましたが、実際の相場では見通しとは異なり2012/02/07に新高値をとりました。

この見通しを変更することを考えましたが、見通しを変更しなくて良いと思っております。

13000ドル前後でダウが足踏みしている様子をみると、誤った考え方ではないと思います。

ダウの1938/11/10高値から1939/09/12の戻り高値までは210営業日あります。

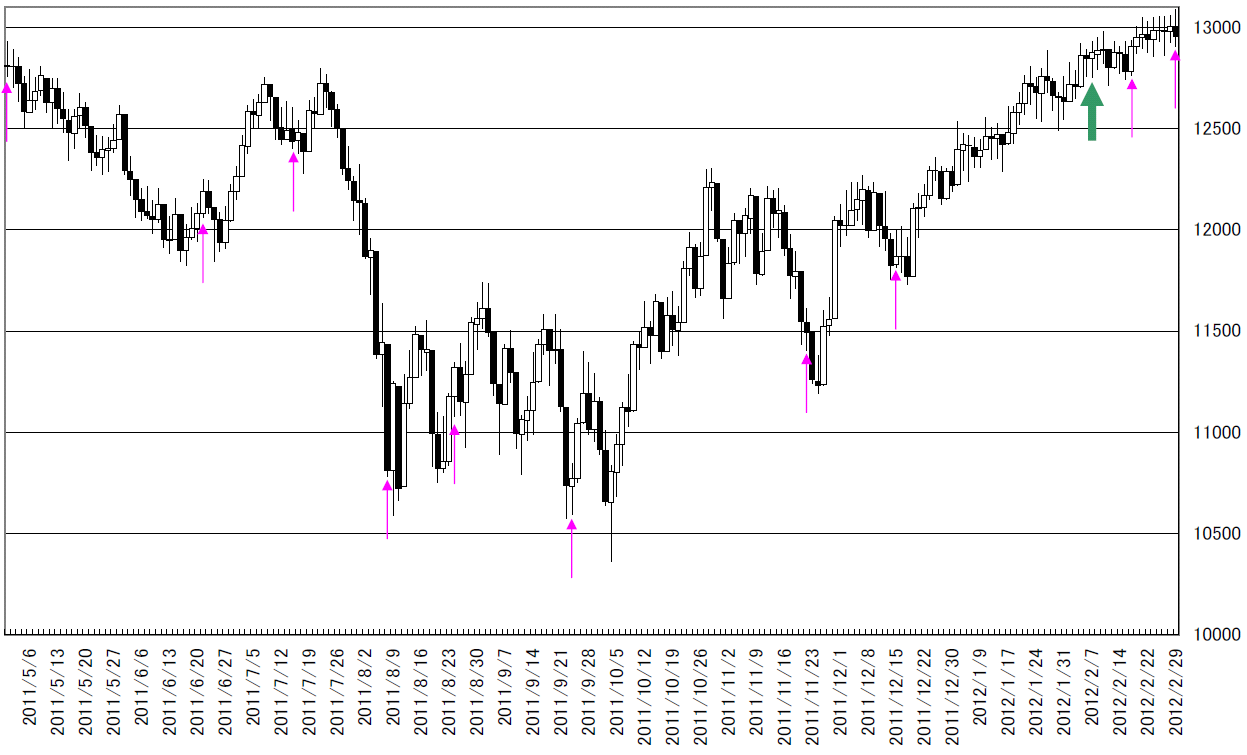
2011/05/02高値から2012/02/29までも210営業日です。

1938-1939年の頂点位置を現在の相場に合わせこむと変化点しており、似通っていると感じます。

In our 02/02/2012 outlook, we reported “DJI did not go over 05/02/2011 high price” basis, but in real market, the market price took new high in 02/07/2012.

We might change our outlook, but we will not change.

Because the DJI market price is sticky 13000 point around.

This is the chart from 11/10/1938 to 09/12/1939 and plotted 210 business days.

And it takes 210 business days from 05/02/2011 to 02/29/2012.

We marked peak point in 1938-1939 chart and marked same point in 2011-2012 chart.

We think this is similar.
2011-12

1938-39


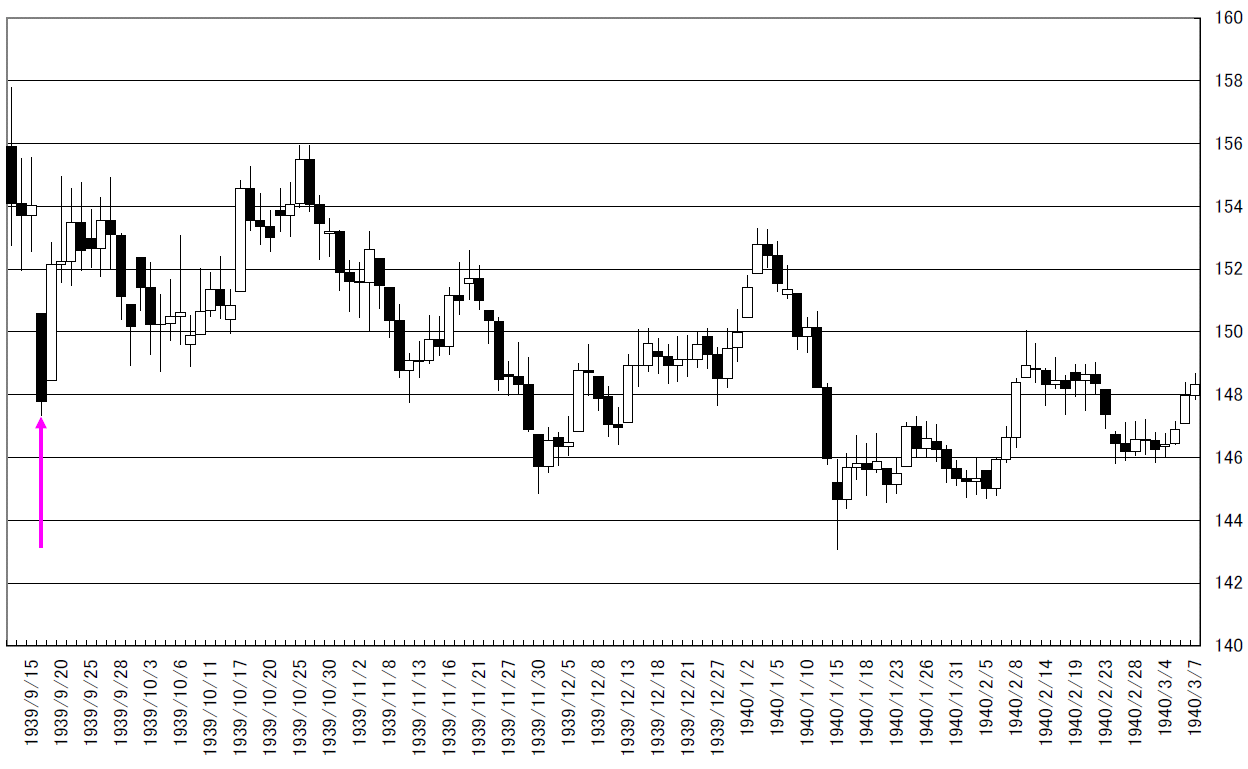
1939/09/12以降の相場を示します。

これを現在の相場に当てはめると矢印で示す「暴落の日」は2012/03/05になります。

2012/03/05にダウが動けば相場の正体が見えてくると思います。

This is the chart after 09/12/1939.

Applying the big fall day in recent market (marked in arrow), this is 03/05/2012.

If DJI become fall or jump at 03/05/2012, we may catch the market figure.
after


相場分析のリクエストがありましたら“Contact Us”からお知らせください。ご要望にお応えできるように努力いたします。

このブログはあくまでも個人的な見解であり、投資判断は各自でお願い致します。当ブログは一切の投資損益に対する責任を負いません。

ホームページに来て下さってありがとうございます。明日もよろしくお願いいたします。

If you have some request to analyze, please write to “Contact Us”.

We do best effort for your request.

These are only personal opinions on this blog, and you need the investment judgment in each one. This blog doesn’t assume the responsibility to all the investment profit and loss.

Thank for watching our contents. My best regards next day.
ジム・ロジャース氏は金を月曜日に買ったそうです。なぜ?/Mr. Jim Rogers bought some gold on Monday. Why?

2012/02/29

世界で最も有名な投資家であるジム・ロジャース氏は金を月曜日に買ったそうです。

本日は、手口についてNY金ベースで分析してみたいと思います。

東京金のマーケットの見方と異なっているので注意してください。

World most famous investor Mr. Jim Rogers bought some gold on Monday.

Today, we analyze his method by NY gold market.

This report is different form Tokyo market analyzes.


はじめに2012/02/23レポートの計算値を思い出してみます。

2012/02/23レポートでは、1793.3ポイントはN計算値であるためレジスタンスポイントとして十分意識する必要があります。

月曜日CLOSE時点までの高値は、1789.5ポイントであり到達せず下落する恐れもあるため注意が必要なポイントです。(昨日は1792.7ポイント)

そのかわりN計算値をしっかり上回るとターゲットはE計算値が2073.8ポイント、V計算値2084.9ポイントとなります。

結論としては、私たちの場合は慎重にみている段階です。

First, we review our 02/23/2012 market report.

In 02/23/2012 report, 1793.3 point is N calculation point and we need to notice this may be resistance point.

The highest point during Monday market close is 1789.5 point; this price did not cut the N calculation and may become the highest point. (Last day’s highest was 1792.7point.)

If the market price will go over N calculation point, the next target price is E calculation point (2073.8point) or E calculation point (2084.9point).

The conclusion, we are now watching the market price.

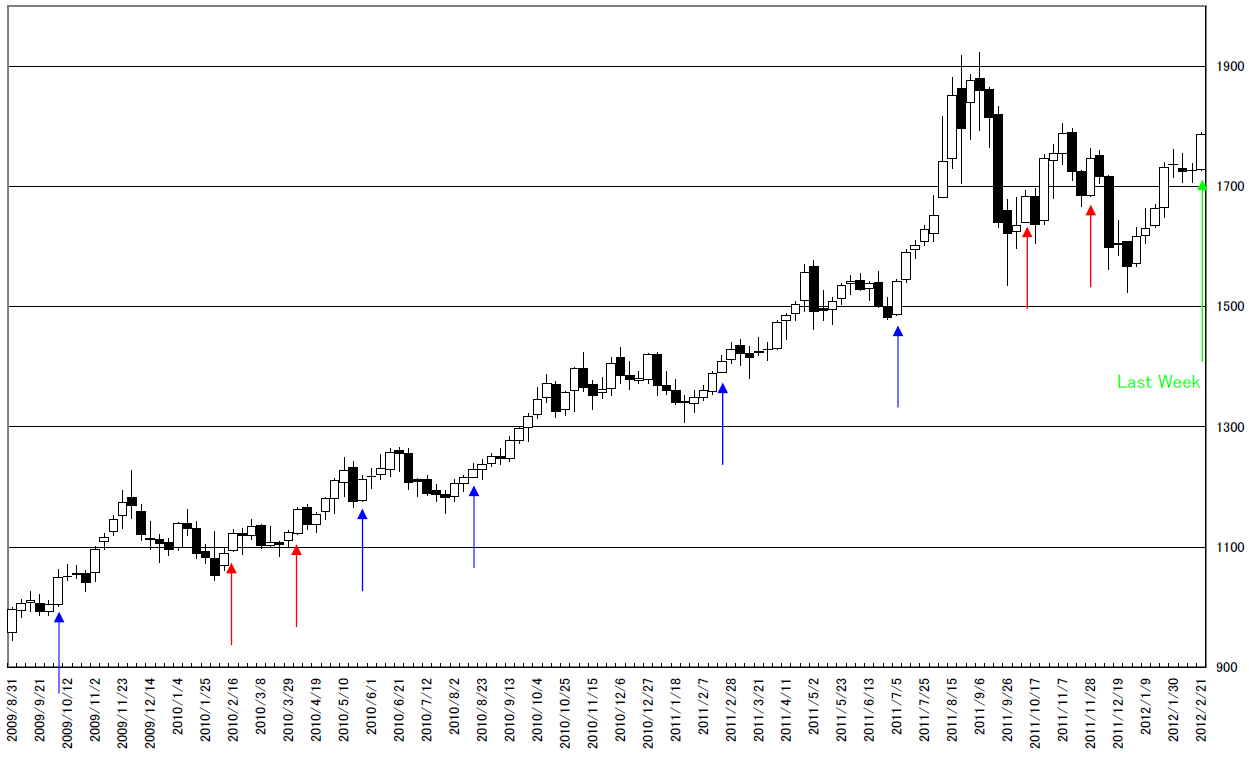
CHART 


2012/02/24のレポートでお知らせしたとおり、NY金は羽黒5号線をだしました。

教科書には、羽黒5号線は「次週寄付きが終値近辺で始まる場合は、陽線を出しやすい」と書いてあります。

しかしながら、直近過去の2回では陰線を引いているところ(チャート赤)もあります。

羽黒足では判定にはなりません。

We reported “NY GOLD weekly. If a slump does not occur, the market price will form “HAGURO” No.5 or No.8 formation.” on 02/24/2012 report.

In our textbook, the “HAGURO” No.5 formation means “If next week open price may very close to last week close price, it will appear white candle stick”.

But in the latest 2 occasions, the market price formed black candle stick.

So, we think this does not suggest a good opportunities.

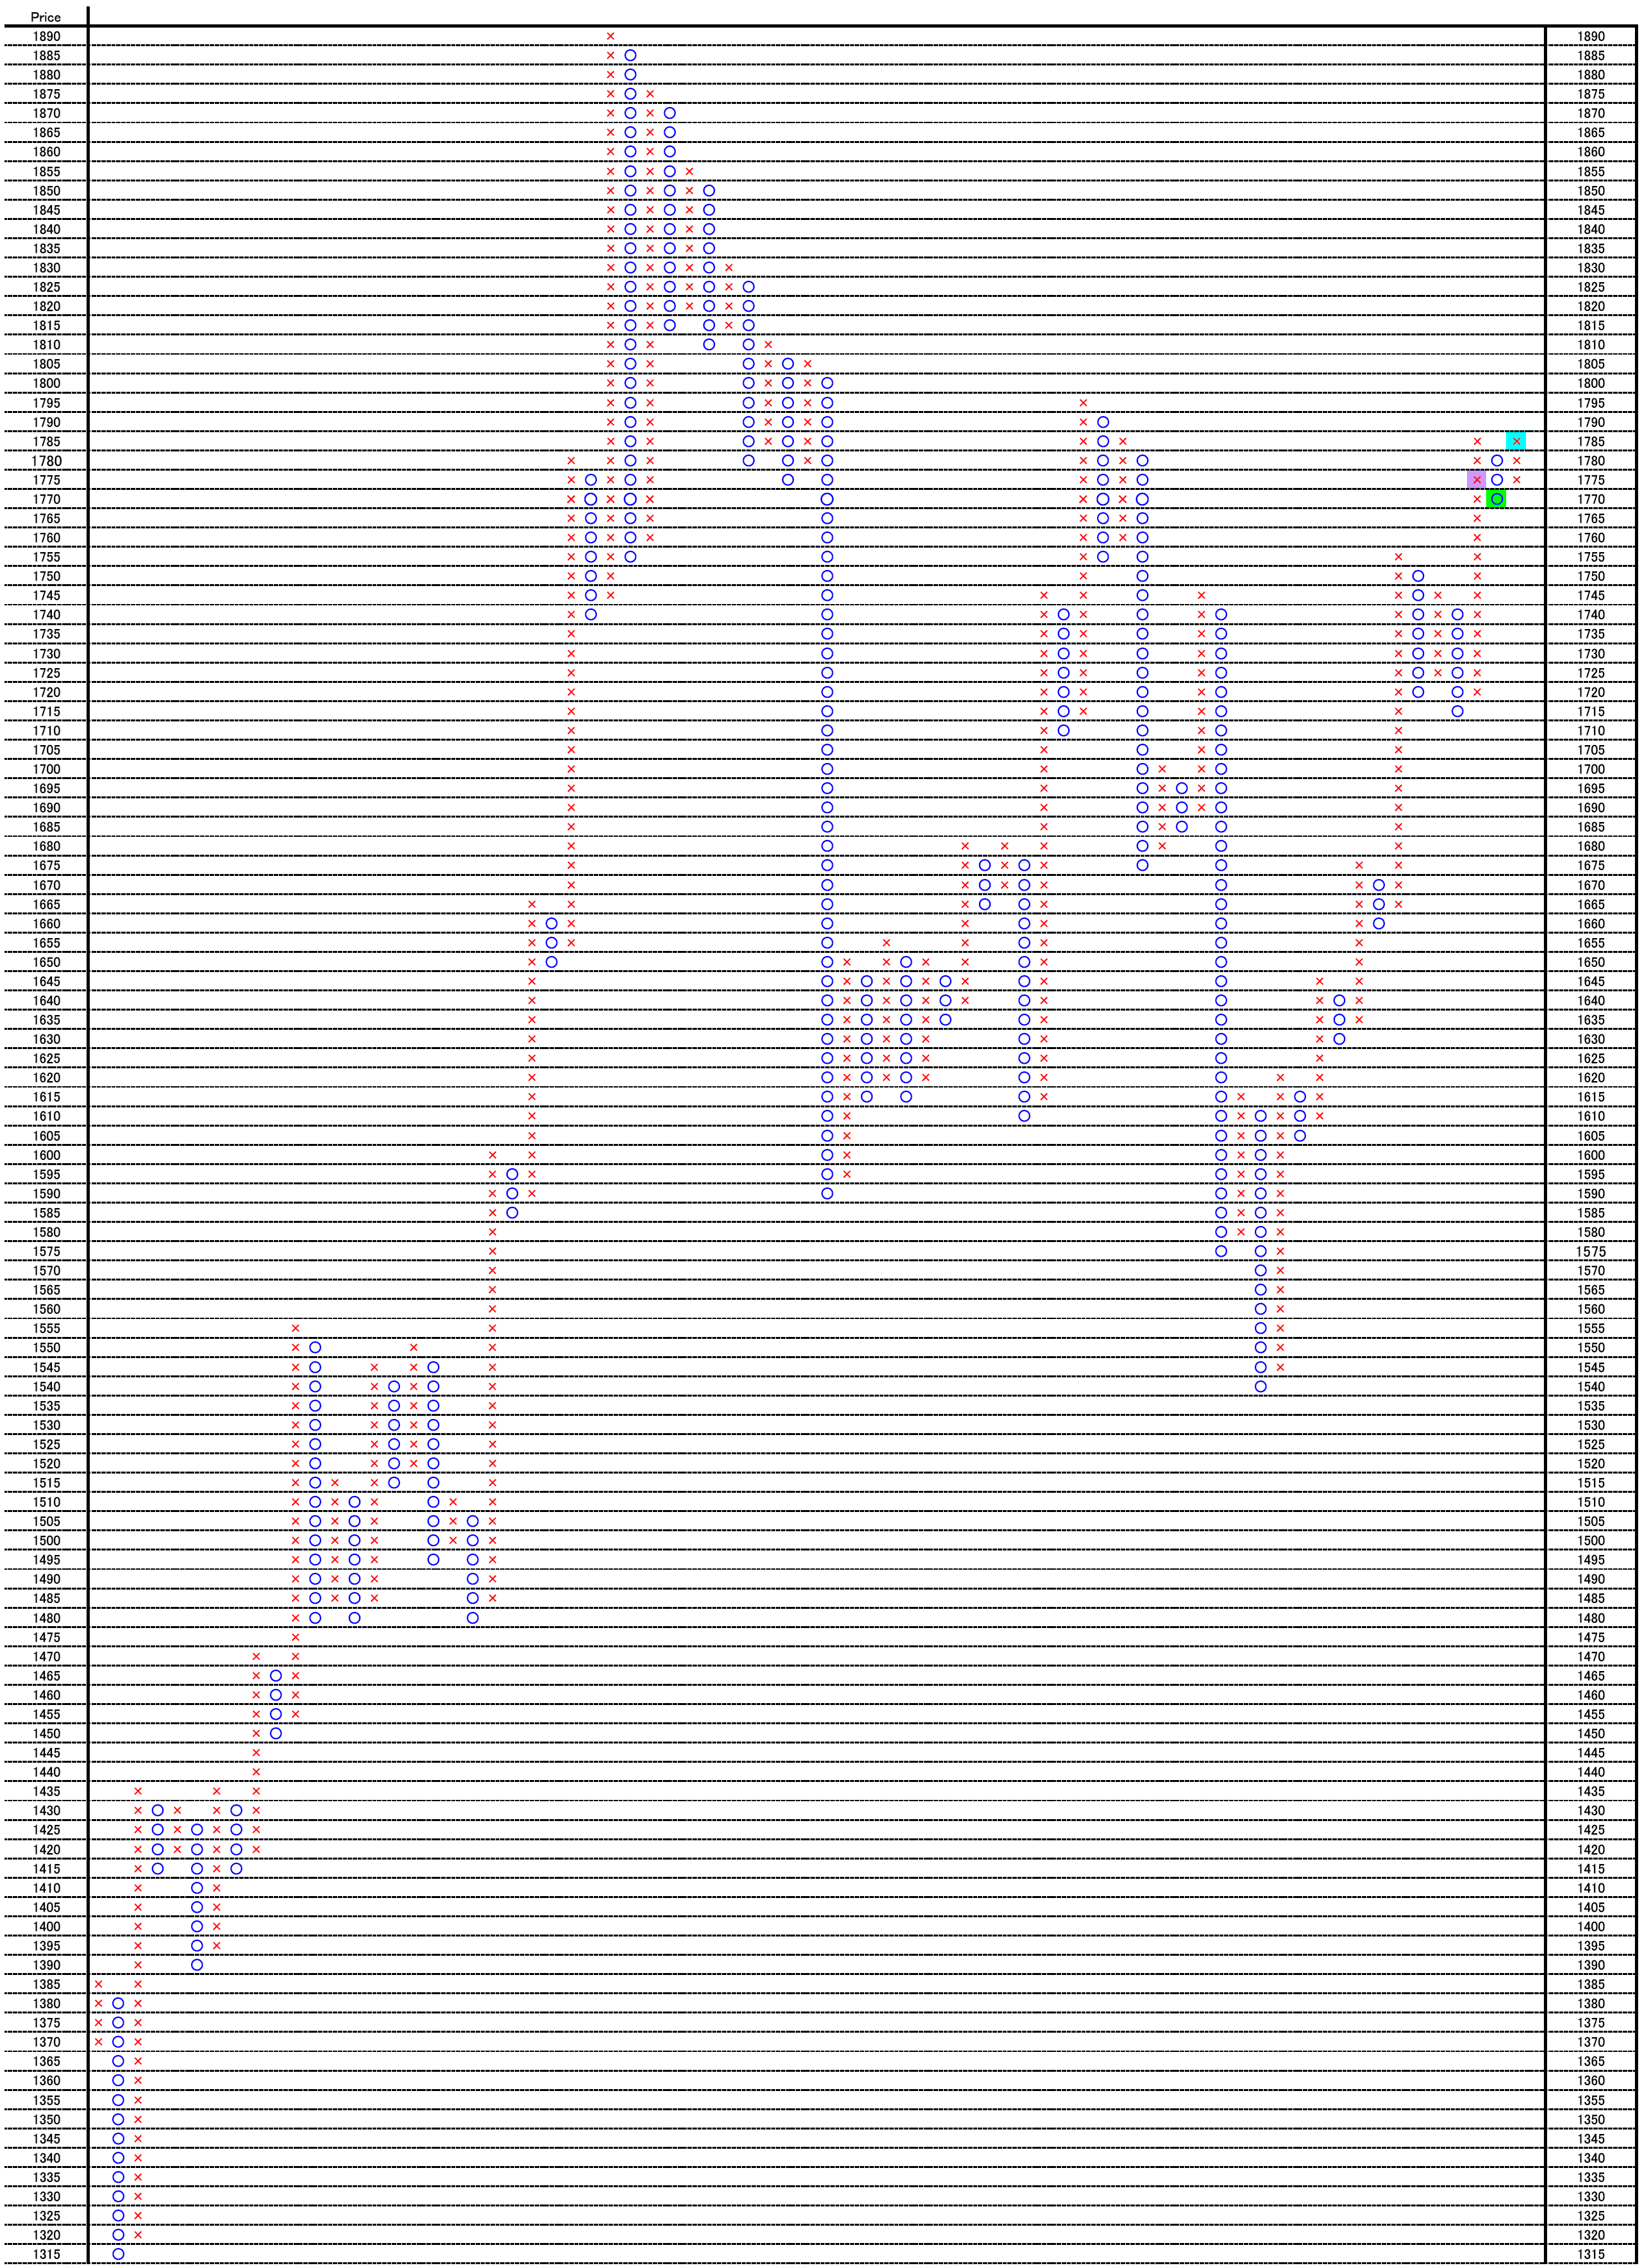
PF


値動きを見ていくと、月曜日に押しをつくっていることがわかります。

(紫:2012/02/24、緑:2012/02/27、水色:2012/02/28)

3枠の下落後直ちに反転しているため、弱い押し目であった可能性があります。

The market price made a dip on Monday.

(Purple: 02/24/2012, Green: 02/27/2012, Walter blue: 02/28/2012)

The market price moved 3 boxes down side and quickly back, so this may be a weak dip.


Date

Close Price

2012/2/28

1788.4

2012/2/27

1774.9

2012/2/24

1776.4


相場分析のリクエストがありましたら“Contact Us”からお知らせください。ご要望にお応えできるように努力いたします。

このブログはあくまでも個人的な見解であり、投資判断は各自でお願い致します。当ブログは一切の投資損益に対する責任を負いません。

ホームページに来て下さってありがとうございます。明日もよろしくお願いいたします。

If you have some request to analyze, please write to “Contact Us”.

We do best effort for your request.

These are only personal opinions on this blog, and you need the investment judgment in each one. This blog doesn’t assume the responsibility to all the investment profit and loss.

Thank for watching our contents. My best regards next day.
© 2026 Retar