
シカゴ・オプションVIX(恐怖心理指数)日柄。今度上昇したときの参考に/Chicago Options: ^VIX Daily. When the ^VIX value rise higher again, we can use this report for reference.

2012/02/18

本日はシカゴ・オプションVIX(恐怖心理指数)日足についてです。

Today, we analyze Chicago Options: ^VIX Daily data.


今回はVIXの日柄の特徴について調査しました。

VIXでは、急激な変化時が起こるときに利益が上げられるので、参考にしていただくと良いと思います。

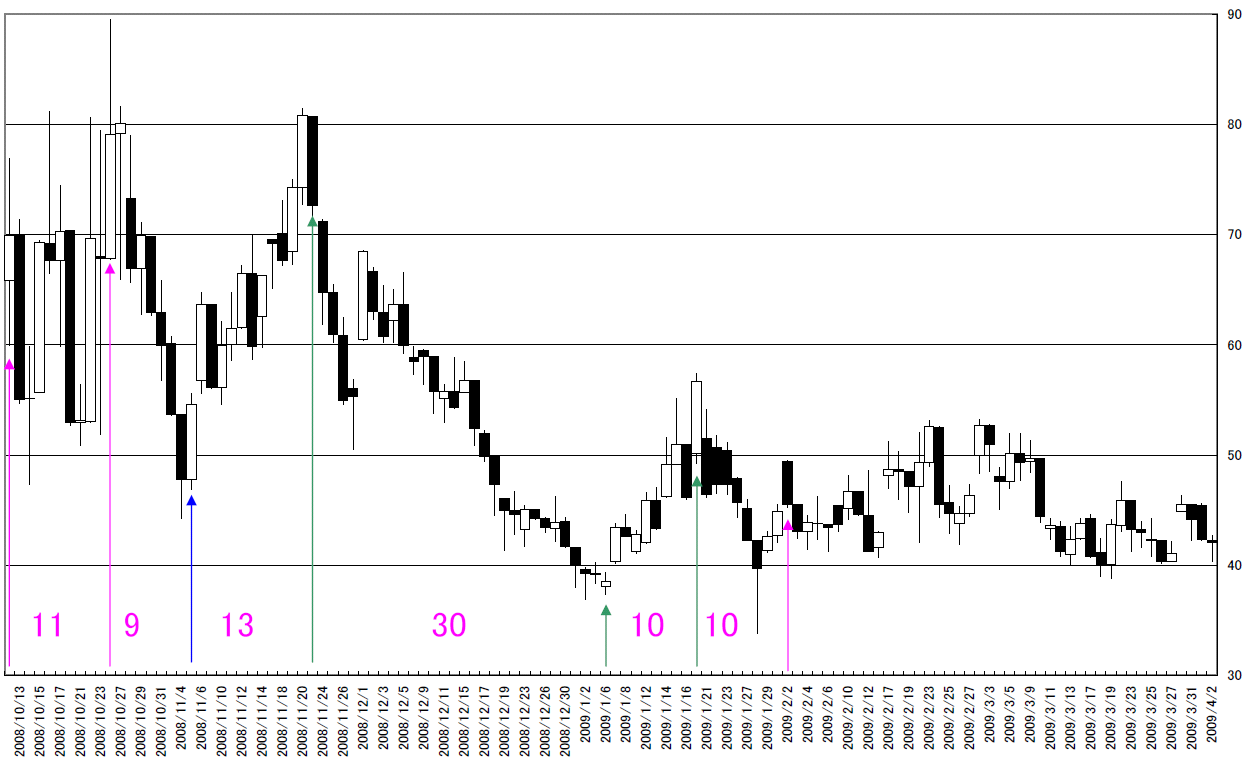
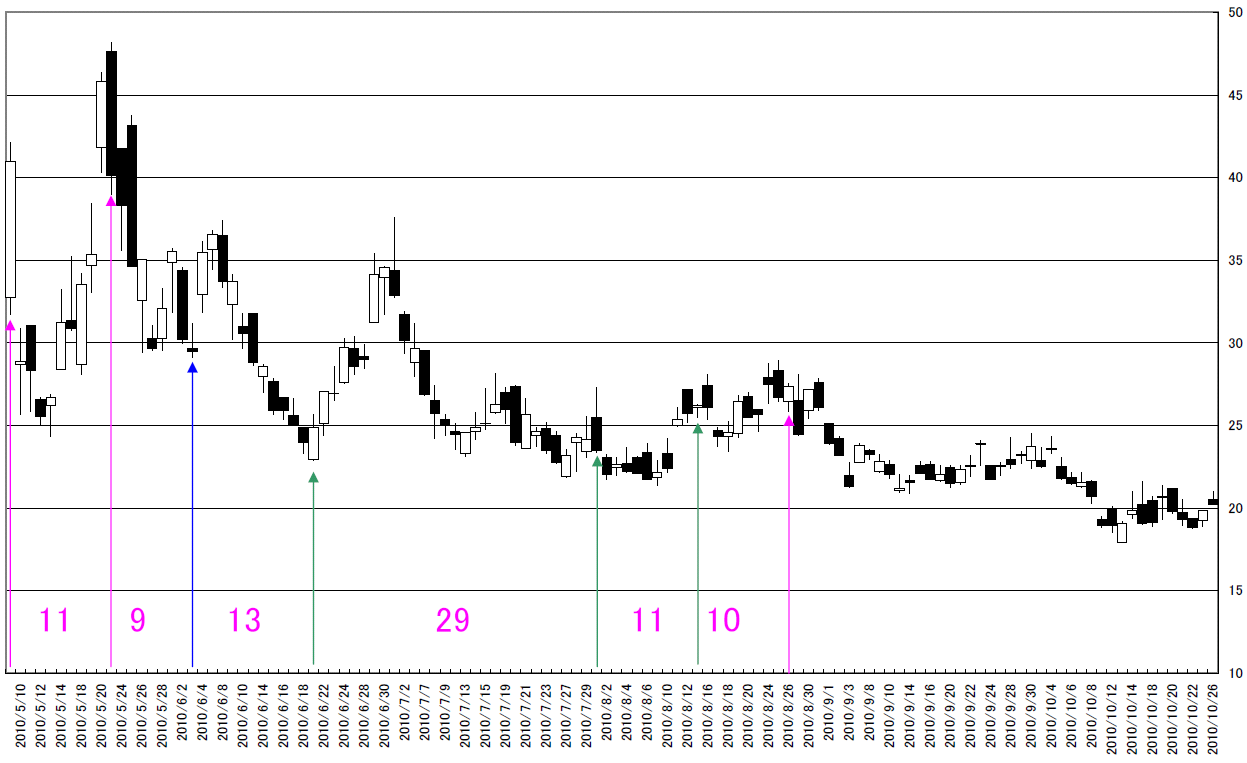
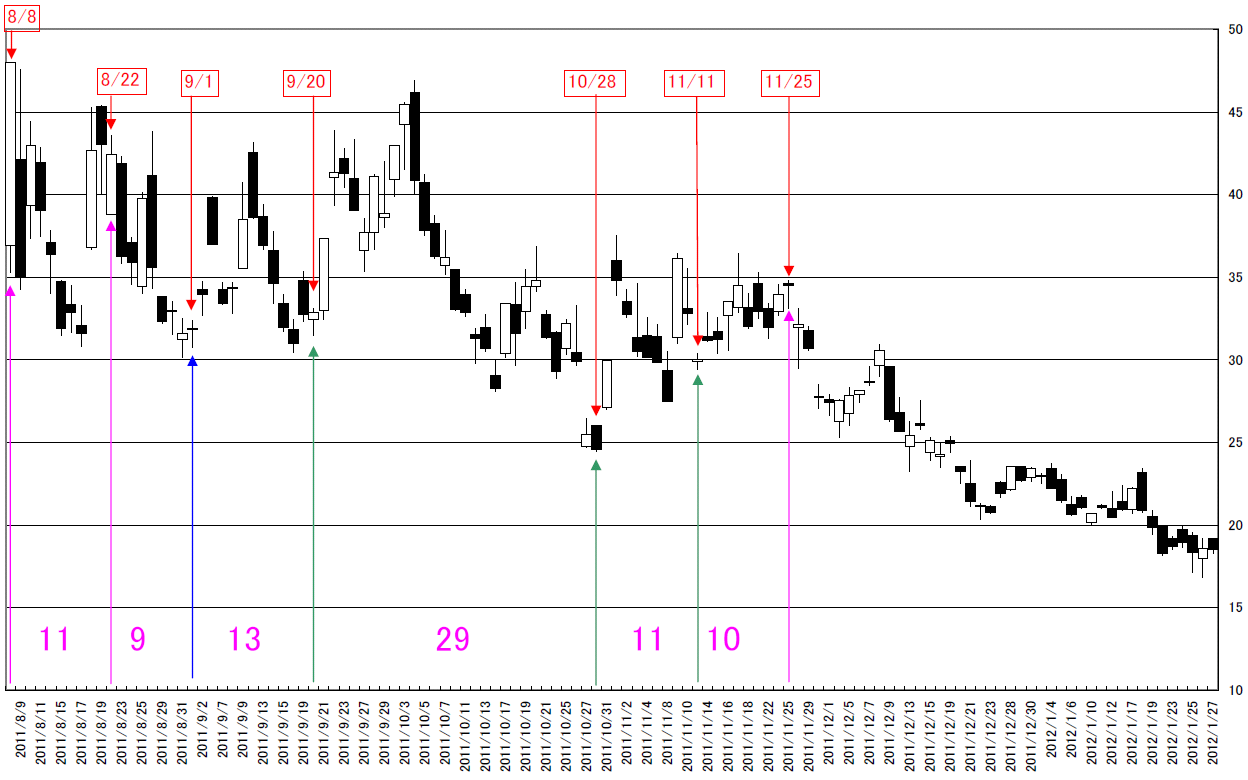
以下のチャートは、大きく動いたときのチャートです。

急激に上昇したときの最高点をスタート時点にしております。

(ピンクは高値ポイント、青は安値ポイント、緑は変化点)

Today, we analyze unique characteristics of VIX “HIGARA”.

There are many opportunities when the VIX index volatile.

Under these charts are VIX index went into volatile.

The starting point is the first peak of the crisis.

(Pink: Peak point. Blue: Bottom point. Green: trend changing point.)


リーマンショック(2008年)/Lehman Shock (2008)
2008


ギリシャショック(2010年)/Greek financial crisis(2010)
2010


米国債格下げ(2011年)/U.S. Treasury bond degradation(2011)
2011


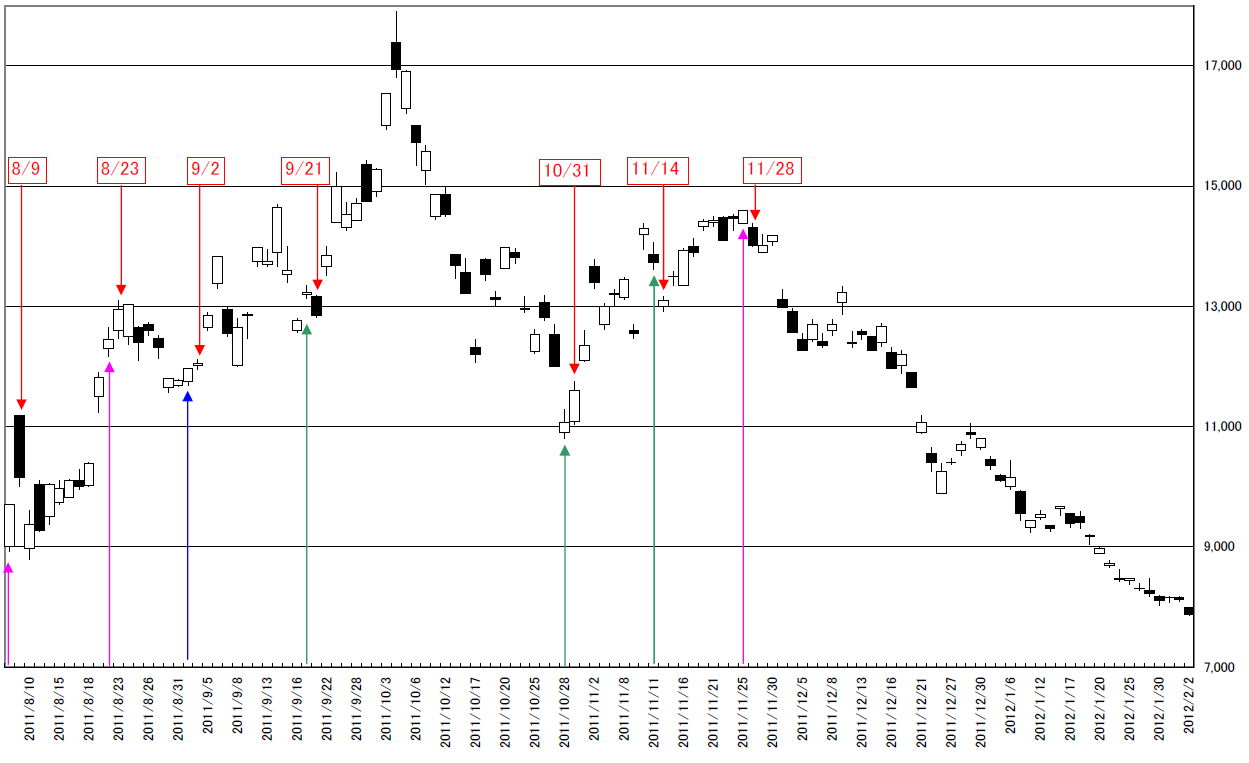
東証にも「【1552】国際のETF VIX短期先物指数」というのがあります。

上場して日が浅いようなので、2011年のパターンしか比較できませんが、為替リスクをとならない優れた投資機会だと考えられます。

There is “ETF VIX short-term futures index (KOKUSAI)” (ticker code 1552) in Tokyo stock market.

It is not long since it listed, we can only compare 2011 pattern and VIX.

But there is no risk in foreign exchange; we think this stock provides good opportunity.
1552


相場分析のリクエストがありましたら“Contact Us”からお知らせください。ご要望にお応えできるように努力いたします。

このブログはあくまでも個人的な見解であり、投資判断は各自でお願い致します。当ブログは一切の投資損益に対する責任を負いません。

ホームページに来て下さってありがとうございます。明日もよろしくお願いいたします。

If you have some request to analyze, please write to “Contact Us”.

We do best effort for your request.

These are only personal opinions on this blog, and you need the investment judgment in each one. This blog doesn’t assume the responsibility to all the investment profit and loss.

Thank for watching our contents. My best regards next day.
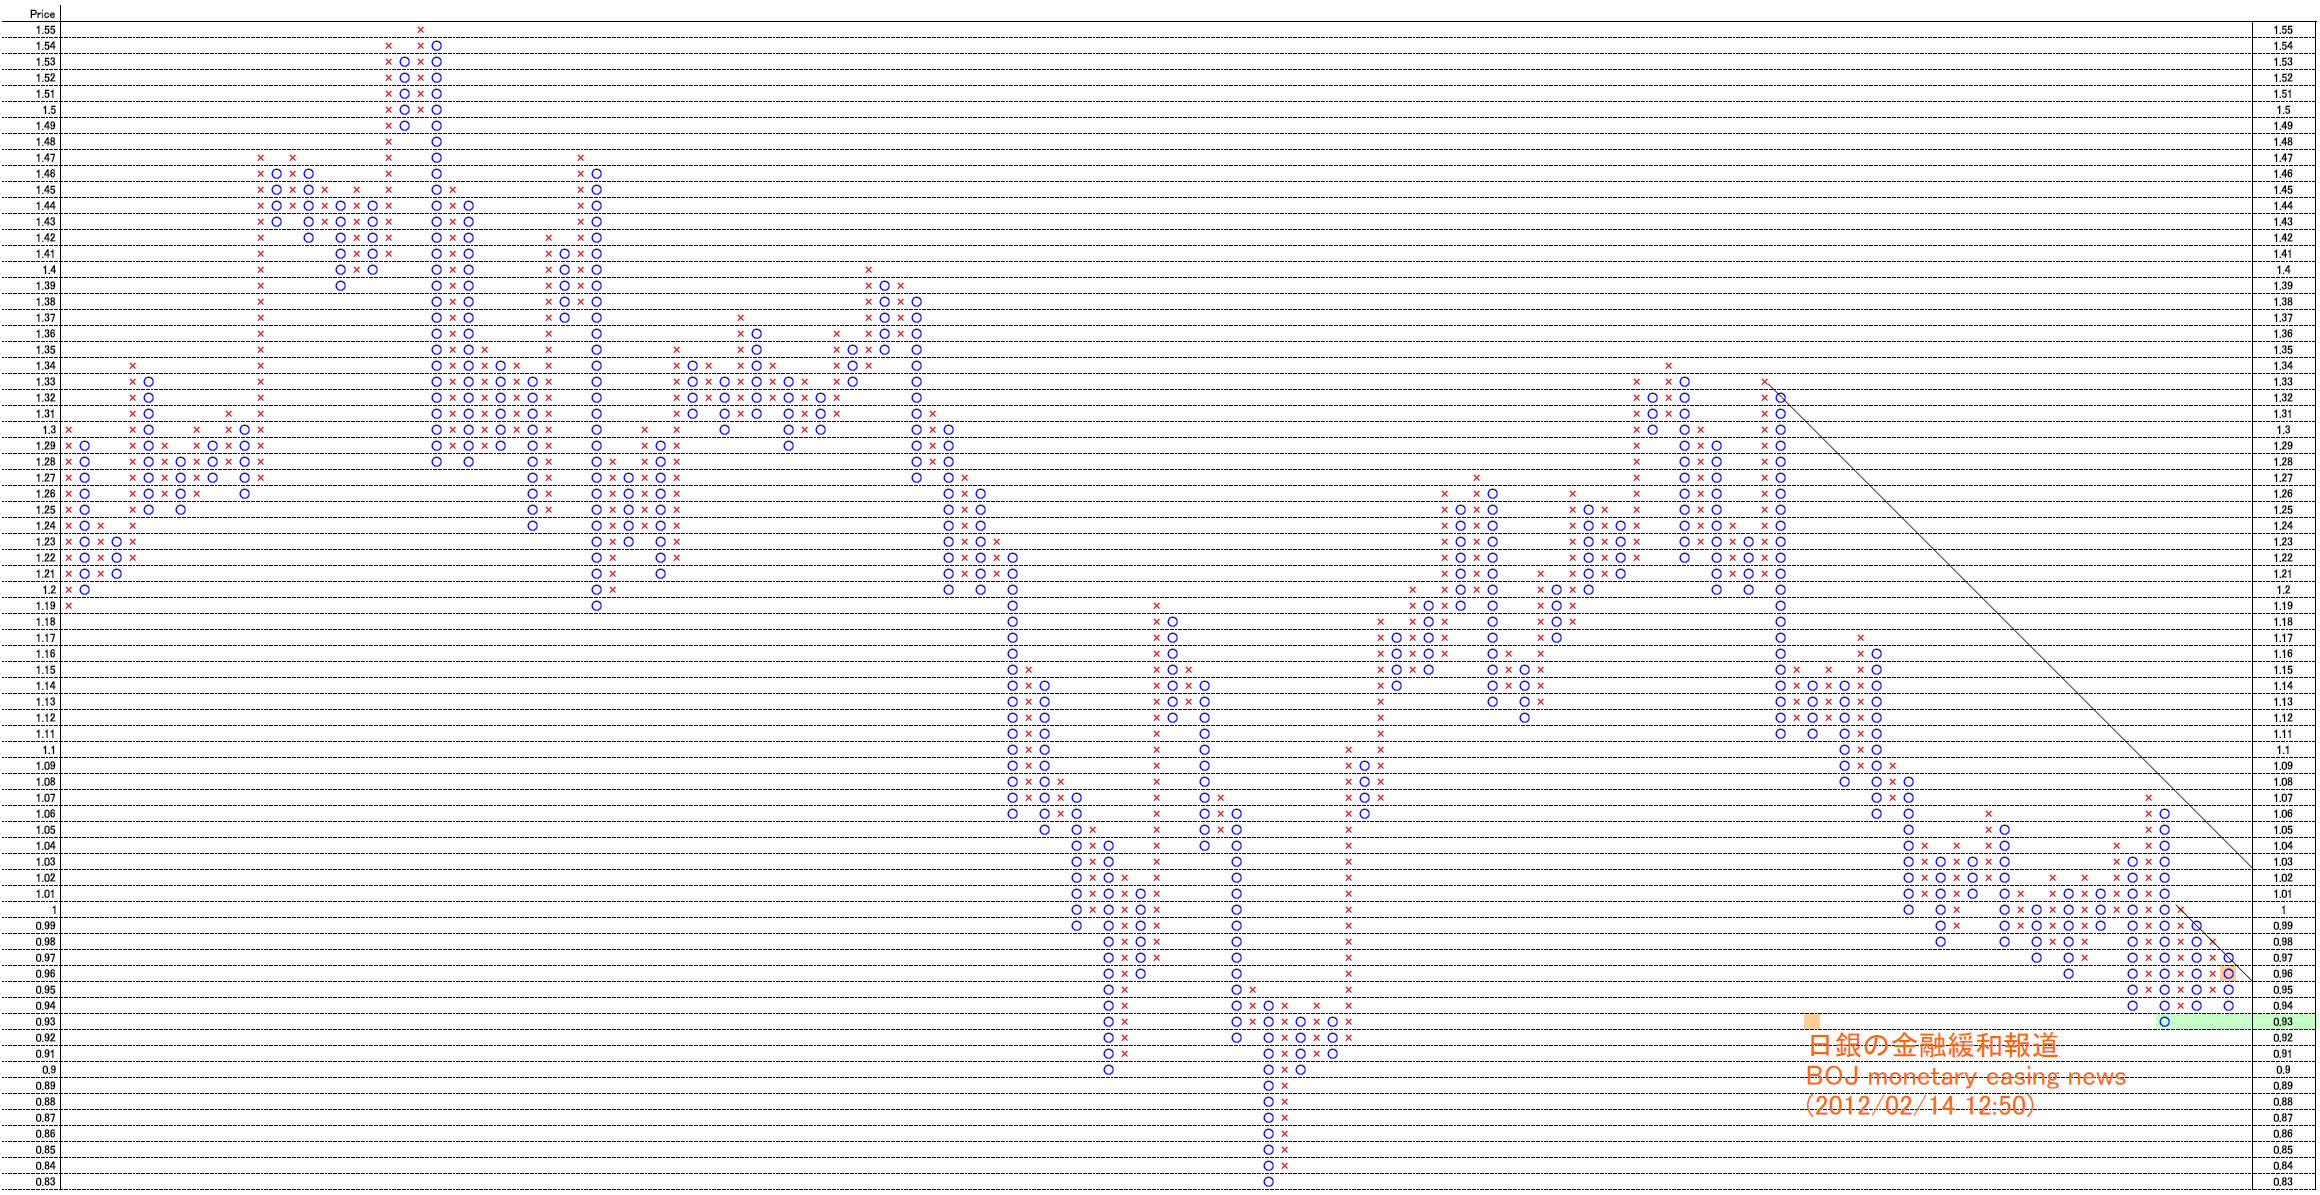
日本10年債利回り日足・この先、金利が正しいのか? 株が正しいのか?/Japanese Government Bonds 10-Year Daily. Hereafter, the interest rate is wrong or the stock rate is wrong.

2012/02/17

本日は、日本10年債利回り日足を分析です。

Today, we analyze Japanese Government Bonds 10-Year Daily.


株が調子良くあがっているので、「悪い金利の上昇」と思いました。

しかし残念なことに、日経新聞のDBを引いても2012/01/13以降に「悪い金利の上昇」という単語はありません。

むしろ、2012/02/14のJOB金融緩和以降、金利は低下傾向です。(金利が下がることをしていますので・・・)

この先、金利が正しいのか? 株が正しいのか?

毎日の日経新聞が楽しみですね。

The Japanese stock rises very strong, so we think “This may be a lovely ‘A Bad interests rise’”.

Sadly, we seek NIKKEI newspaper Database and we can not find out ‘A Bad interests rise’ containing article.

Rather than, after JOB monetary easing, the interest rate is falling. (They managed to reducing the interest rate.)

Hereafter, the interest rate is wrong or the stock rate is wrong.

The daily Nikkei newspaper is pleasure.


1枠0.01ポイント、3枠転換の終値ポイントアンドフィギュアです。

2009/01/05から昨日までのデータで作成しています。

下方ブレークポイントは0.92point。

上方ブレークポイントは上方の45度線なら、1.04point、下方の45度線なら0.97ポイント。

This is 0.01 price change and 3 box reversal close price’s Point and Figure chart.

We calculate it from 01/05/2009 to last day data.

The down side breaking point is 0.92point.

The up side breaking point is 1.04 point or 0.97point (45 degree resistance cutting).

PF


相場分析のリクエストがありましたら“Contact Us”からお知らせください。ご要望にお応えできるように努力いたします。

このブログはあくまでも個人的な見解であり、投資判断は各自でお願い致します。当ブログは一切の投資損益に対する責任を負いません。

ホームページに来て下さってありがとうございます。明日もよろしくお願いいたします。

If you have some request to analyze, please write to “Contact Us”.

We do best effort for your request.

These are only personal opinions on this blog, and you need the investment judgment in each one. This blog doesn’t assume the responsibility to all the investment profit and loss.

Thank for watching our contents. My best regards next day.

© 2026 Retar