本日は米ダウ工業株長期足についてです。
Today’s analyze is Dow Jones Industrial Average (^DJI) long term.
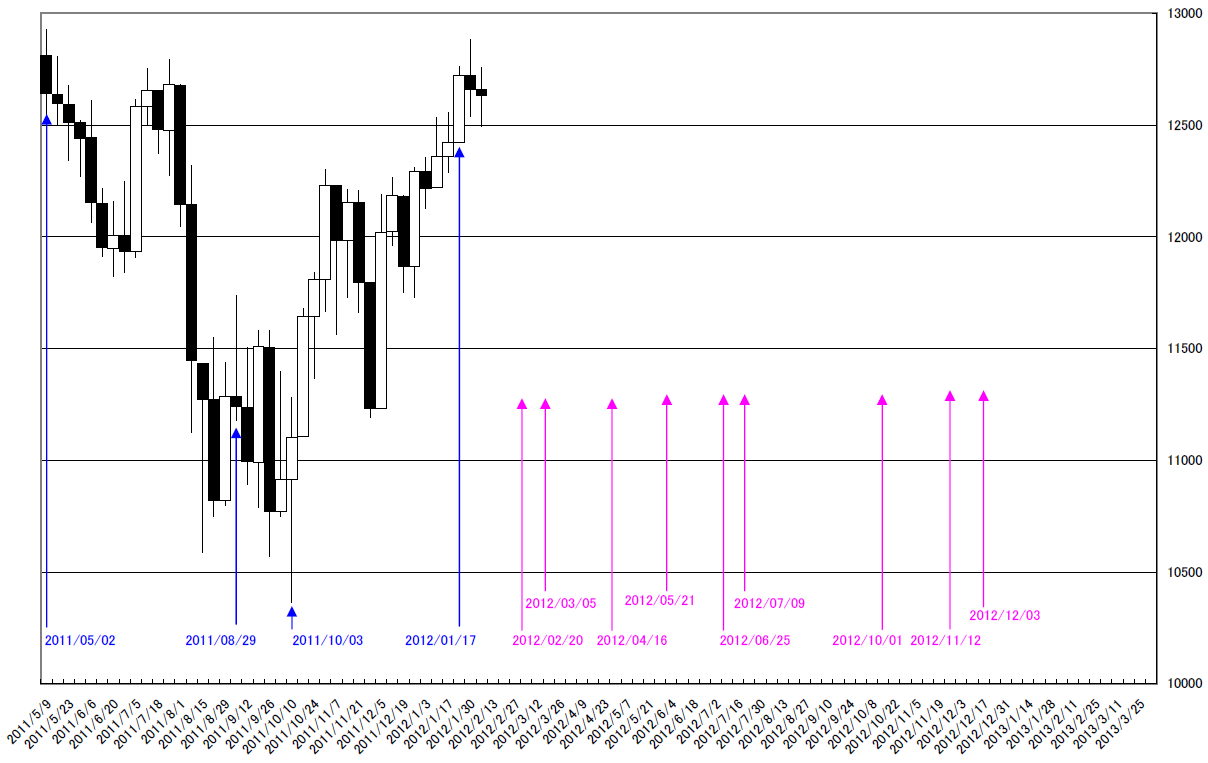
「2011/5/2の週の高値は意味のある高値になると考えられます。」(2011/11/10レポート参照)
現在の相場も2011/05/02高値を抜けずにおり、特徴的な相場です。
列挙してみると以下のようにまとめられます。
1.今のところ、ダウは2011/05/02につけた高値を抜いてはおりません。
2.2011/05/02の高値の5ヶ月後の2011/10/04に安値をとりました。
3.2011/10/04の安値の3ヶ月後の2012/01/26に今度はほぼ同水準まで戻しています。
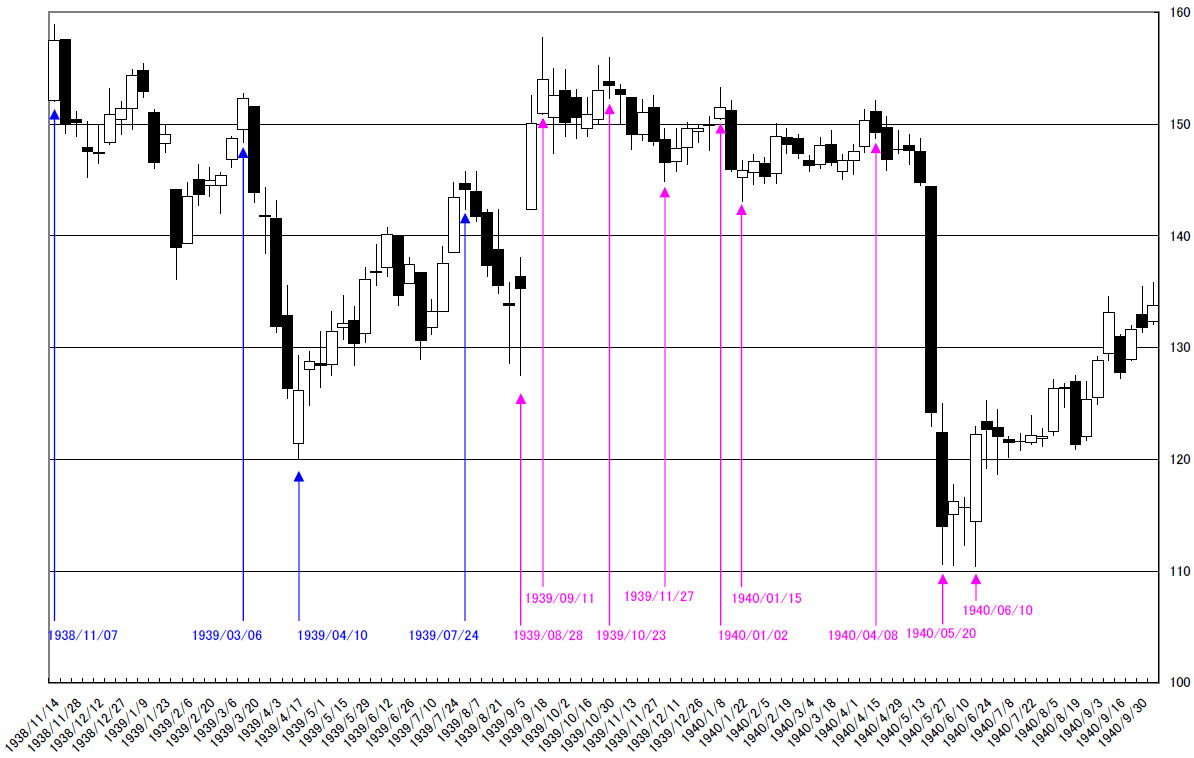
同じような値動きをした相場を1930年代までさかのぼり、徹底調査した結果、1938年から1940年の相場に類似性があると感じました。
1938/11/04の高値は1945/02/19の週まで新高値をとれなかった重要な変化点でした。
また、高値の半年後に高値チャレンジするところはそっくりです。
その後の動きを現在の相場の変化週にあわせてみております。
“We think the high price of 5/2/2011 week is meaningful.” (See our report 11/10/2011)
The recent market, the market price can not go over 05/02/2012 high and this is very unique condition.
The recent unique characters are under these.
1. The DJI high price can not go over 05/02/2011 high price.
2. After taking the high price at 05/02/2011, the market took the low price at 10/04/2011. (It takes about 5 months)
3. After taking the low price at 05/02/2011, the market goes back the nearly close high price and took the high at 01/26/2012.
Investigating the old market price from 1930 to recent and the conclusion, we find out the similarity from 1938 to 1940 market.
The high price of 11/04/1938 was a important “HENKABI” and this market high can not go over at 02/19/1945.
And after taking high, the market price challenged the high price again; this is very similar.
If “HENKA” weeks appear in these case, we marked these future weeks in the recent chart.
相場分析のリクエストがありましたら“Contact Us”からお知らせください。ご要望にお応えできるように努力いたします。
このブログはあくまでも個人的な見解であり、投資判断は各自でお願い致します。当ブログは一切の投資損益に対する責任を負いません。
ホームページに来て下さってありがとうございます。明日もよろしくお願いいたします。
If you have some request to analyze, please write to “Contact Us”.
We do best effort for your request.
These are only personal opinions on this blog, and you need the investment judgment in each one. This blog doesn’t assume the responsibility to all the investment profit and loss.
Thank for watching our contents. My best regards next day.