
今週の日経平均週足は珍しい「羽黒8号線」を出しました。
「羽黒8号線」は売り線です。
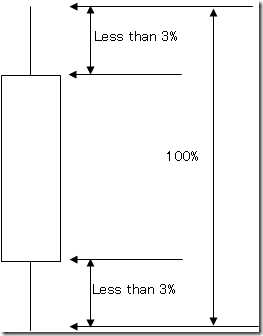
「羽黒8号線」は週足の「陽の丸坊主」ですが、日経平均は指数であるため、ろうそく足の上ヒゲ、下ヒゲが実体の3%以内に納まるものだけとしました。(下記図参照)
In this week, the Nikkei weekly candle stick became rate “HAGURO No. 8 line”.
The “HAGURO No. 8 line” means selling signal.
The “HAGURO No. 8 line” is the body without upper shadow and lower shadow.
But Nikkei is an index; we only adopted the line of the upper shadow and the lower shadow less than 3% of substance. (See the picture)
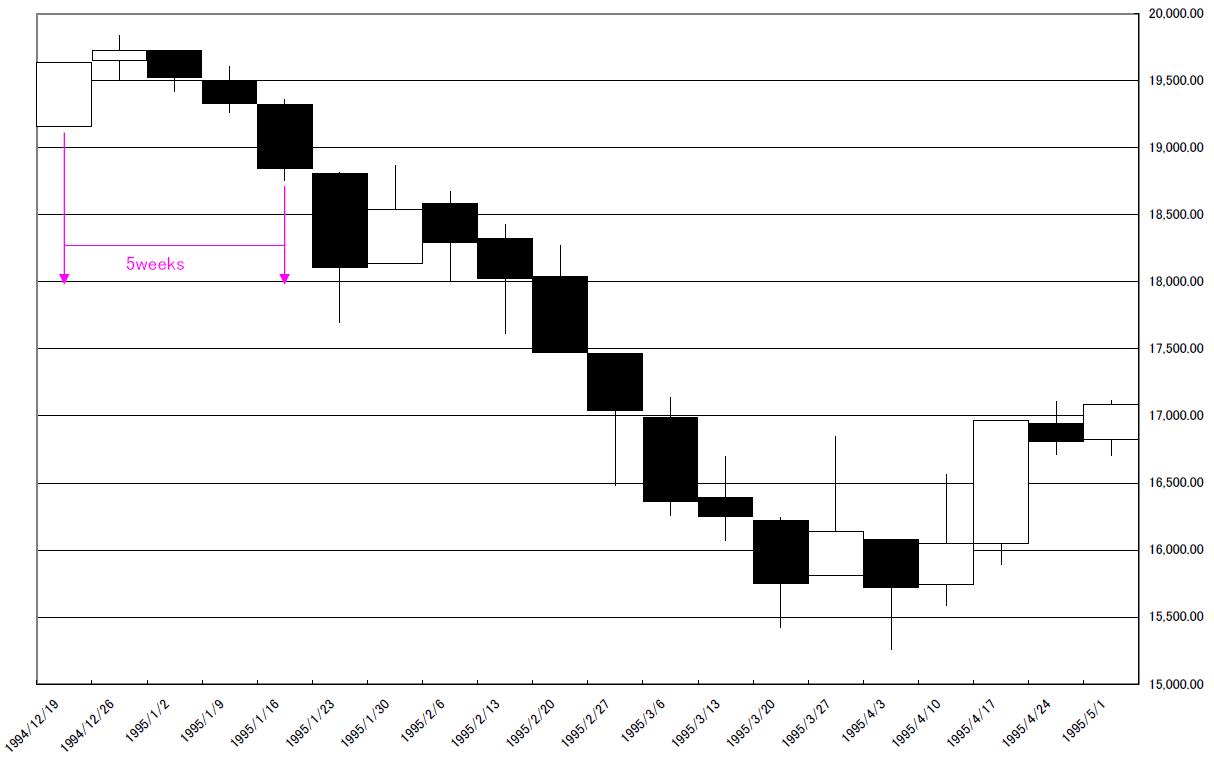
1990年以降に該当する週は以下のようになります。
注目するべきは“☆”の週を除き、18週以内に「羽黒8号線」の始値を割り込んでいることです。
戻り売りが正解となると考えられ、株価が8200円近傍まで戻ってくることを想定するべきだと思います。
The weeks applicable after 1990 are as follows.
The most notable point is that the market price cuts the “HAGURO No. 8 line” open price less than 18 weeks without the “star point”.
We think “Sell on rally” is the best tactics and the market price will come back 8200yen around.
|
WEEK |
OPEN |
HIGH |
LOW |
CLOSE |
CAUTION |
CHART |
|
2011/11/28 |
8,269.91 |
8,653.88 |
8,259.71 |
8,643.75 |
||
|
2009/7/27 |
10,020.87 |
10,359.07 |
10,015.11 |
10,356.83 |
01 |
|
|
2009/7/20 |
9,512.52 |
9,950.04 |
9,508.92 |
9,944.55 |
01 |
|
|
2008/11/24 |
8,026.06 |
8,518.13 |
8,025.69 |
8,512.27 |
02 |
|
|
2004/6/21 |
11,474.39 |
11,780.40 |
11,472.08 |
11,780.40 |
03 |
|
|
2003/12/29 |
10,454.69 |
10,681.28 |
10,454.69 |
10,676.64 |
04 |
|
|
2003/12/22 |
10,248.81 |
10,417.41 |
10,248.62 |
10,417.41 |
☆ |
04 |
|
2003/5/5 |
7,995.49 |
8,156.00 |
7,995.49 |
8,152.16 |
05 |
|
|
2000/8/7 |
15,666.81 |
16,125.66 |
15,666.81 |
16,117.50 |
06 |
|
|
1996/1/1 |
19,945.68 |
20,669.82 |
19,945.68 |
20,669.03 |
07 |
|
|
1994/12/19 |
19,160.03 |
19,633.53 |
19,160.03 |
19,633.53 |
08 |
CHART 01 : 2009/7/20,2009/7/27
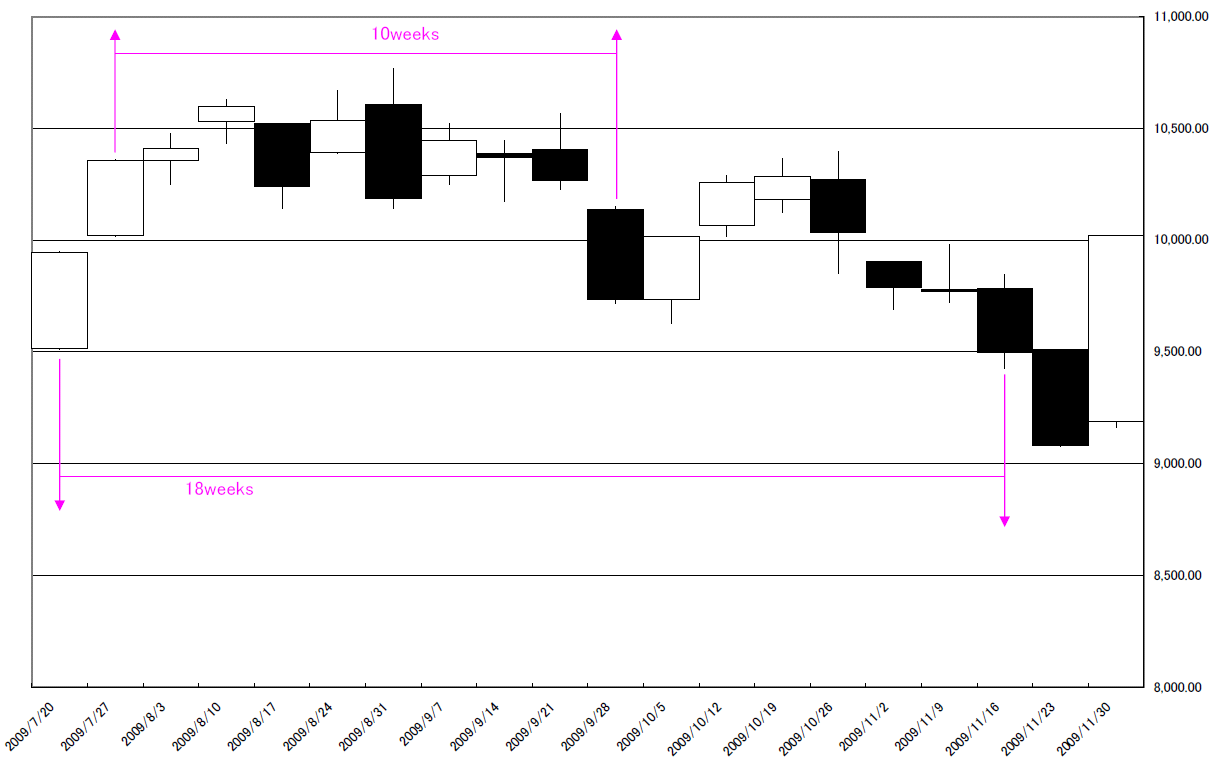
CHART 02 : 2008/11/24
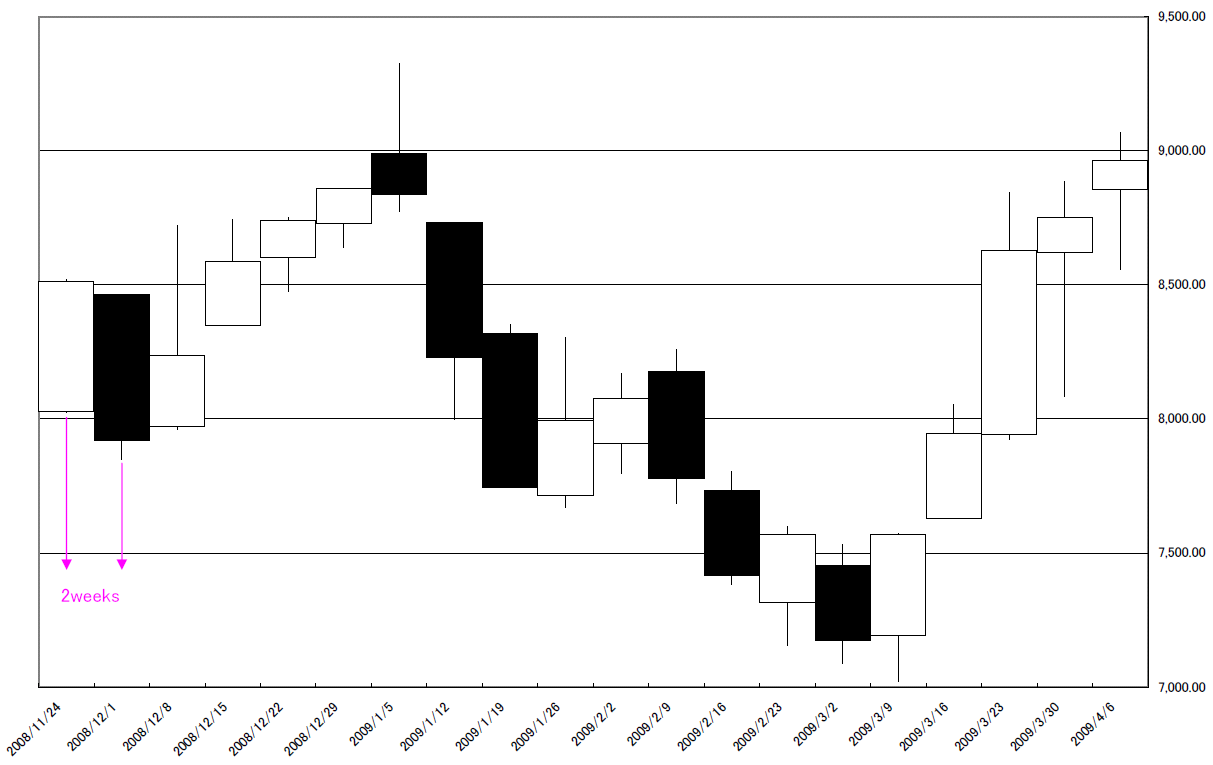
CHART 03 : 2004/6/21
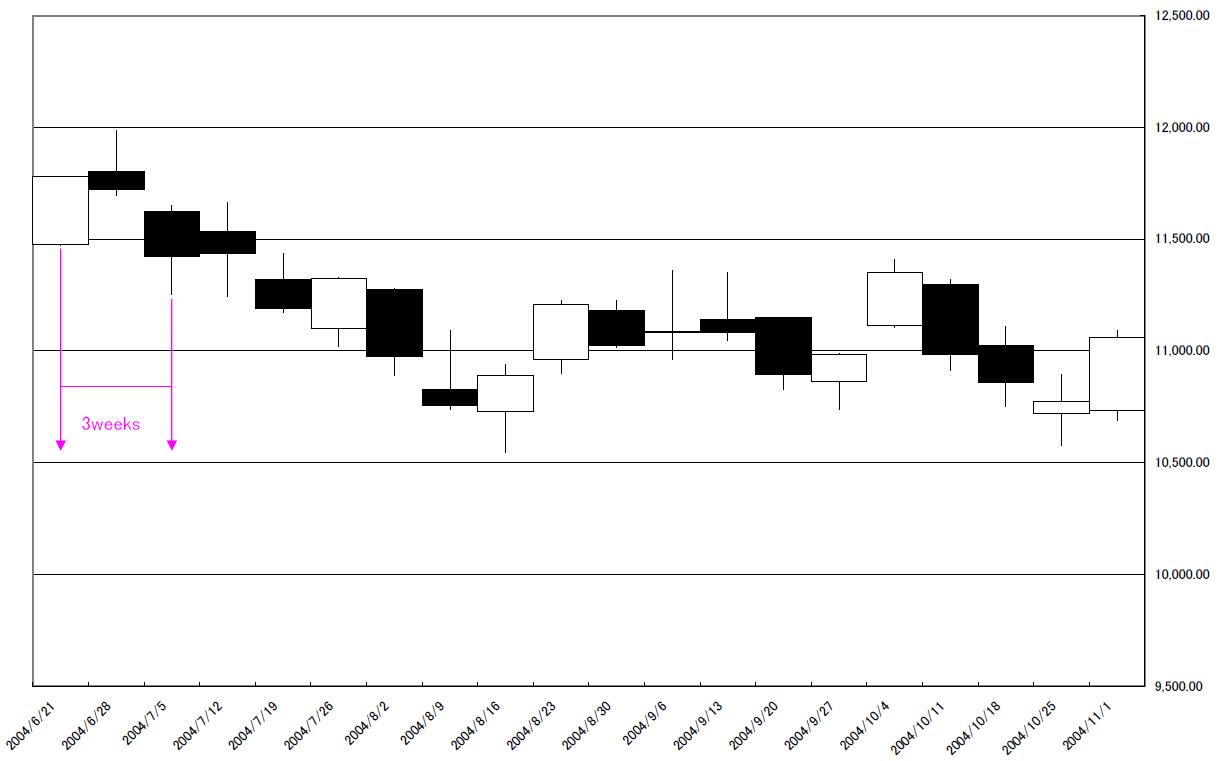
CHART 04 : 2003/12/22,2003/12/29
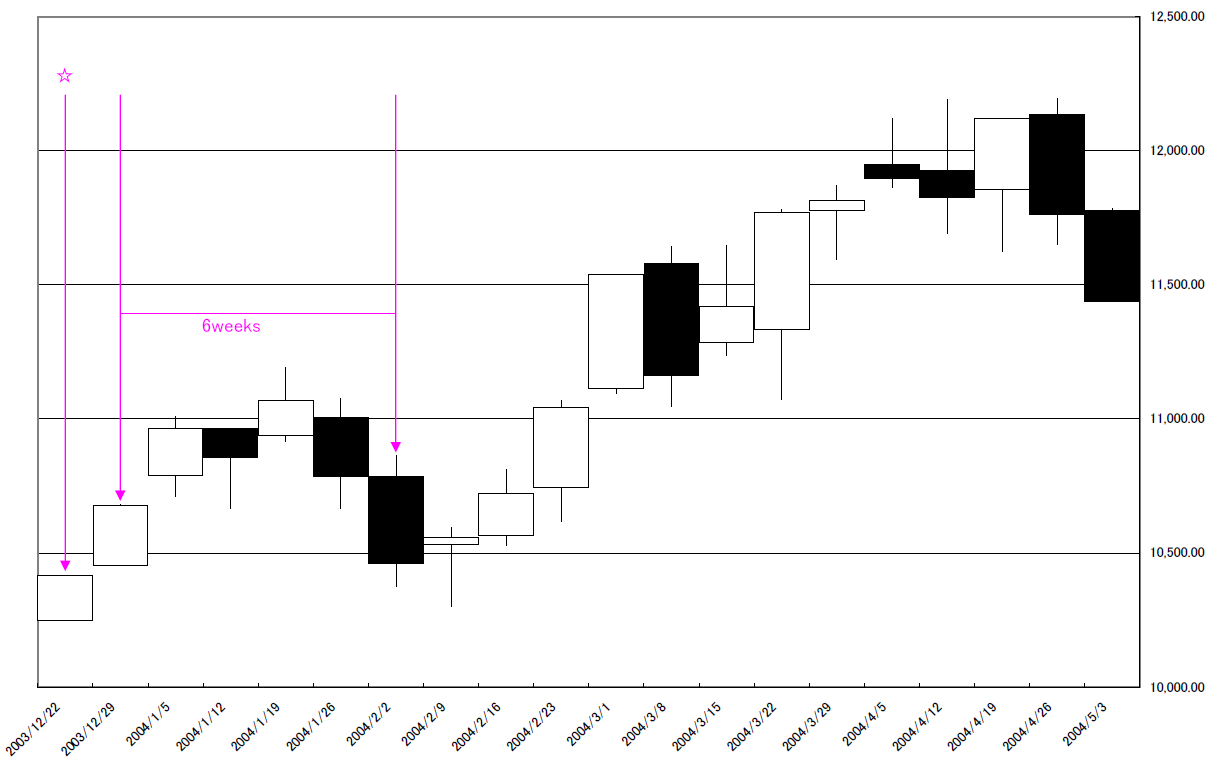
CHART 05 : 2003/5/5
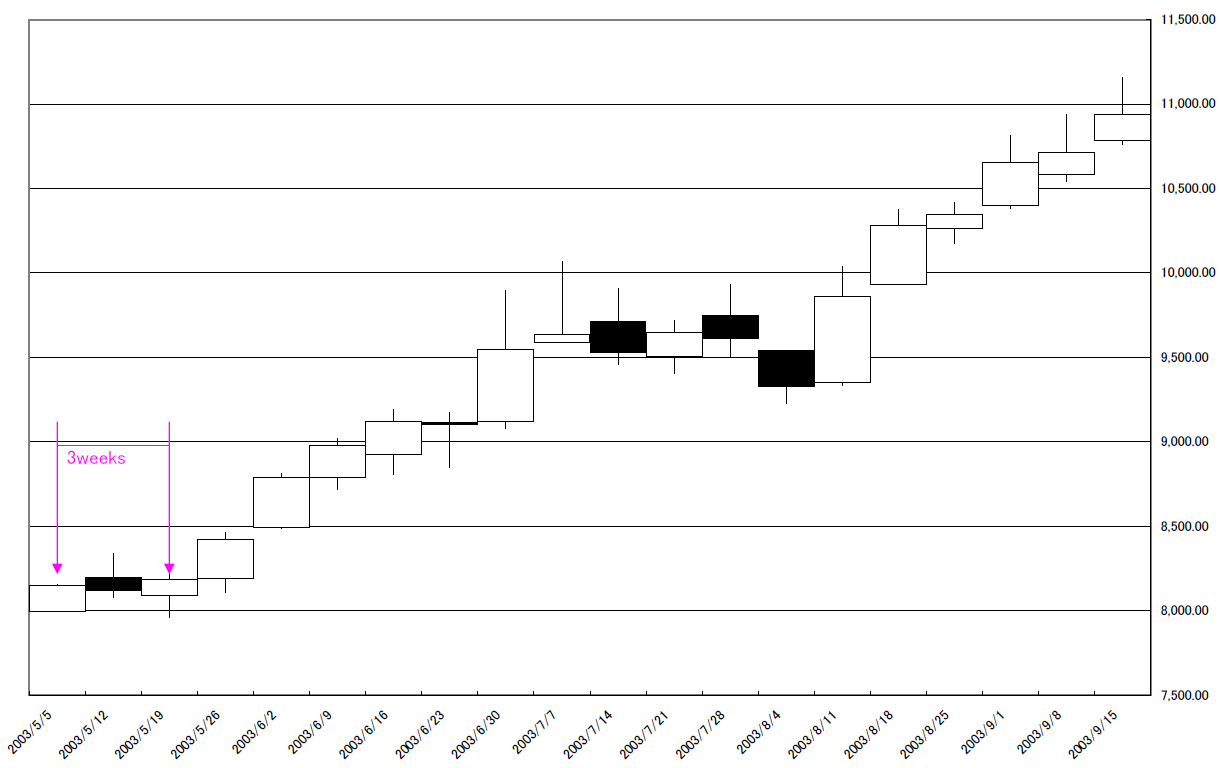
CHART 06 : 2000/8/8
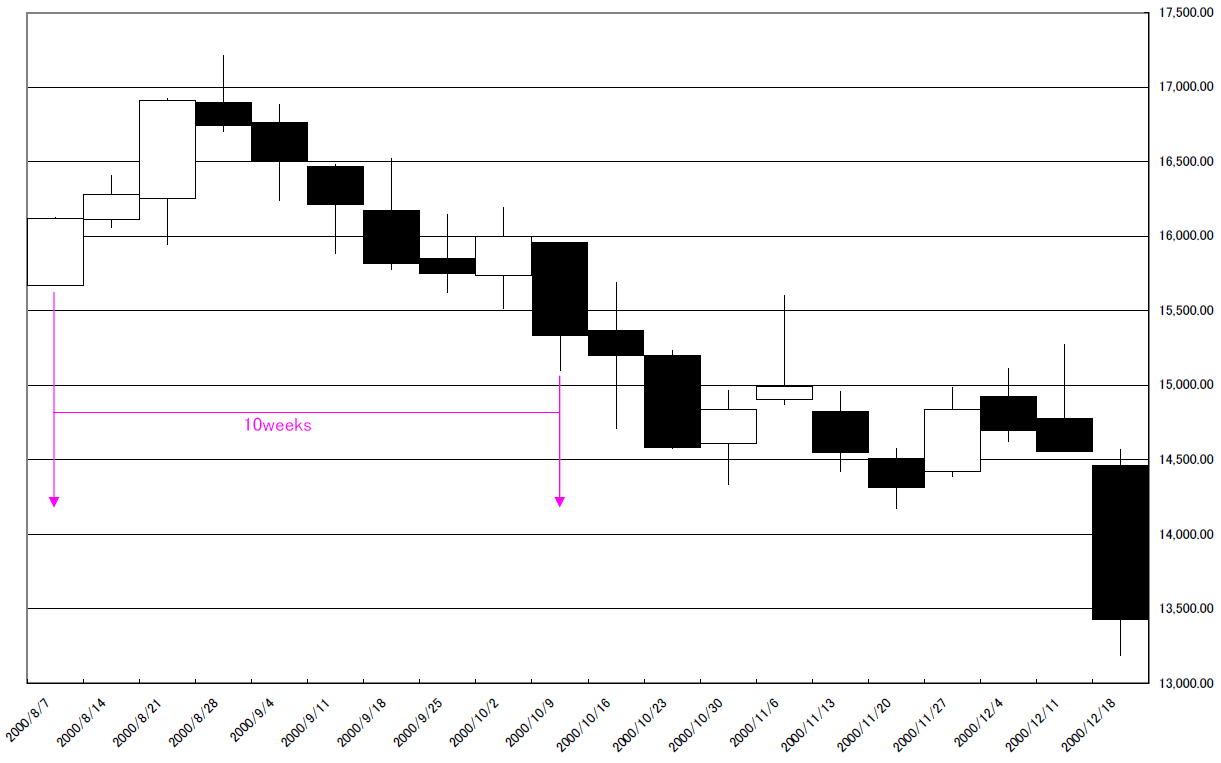
CHART 07 : 1996/1/1
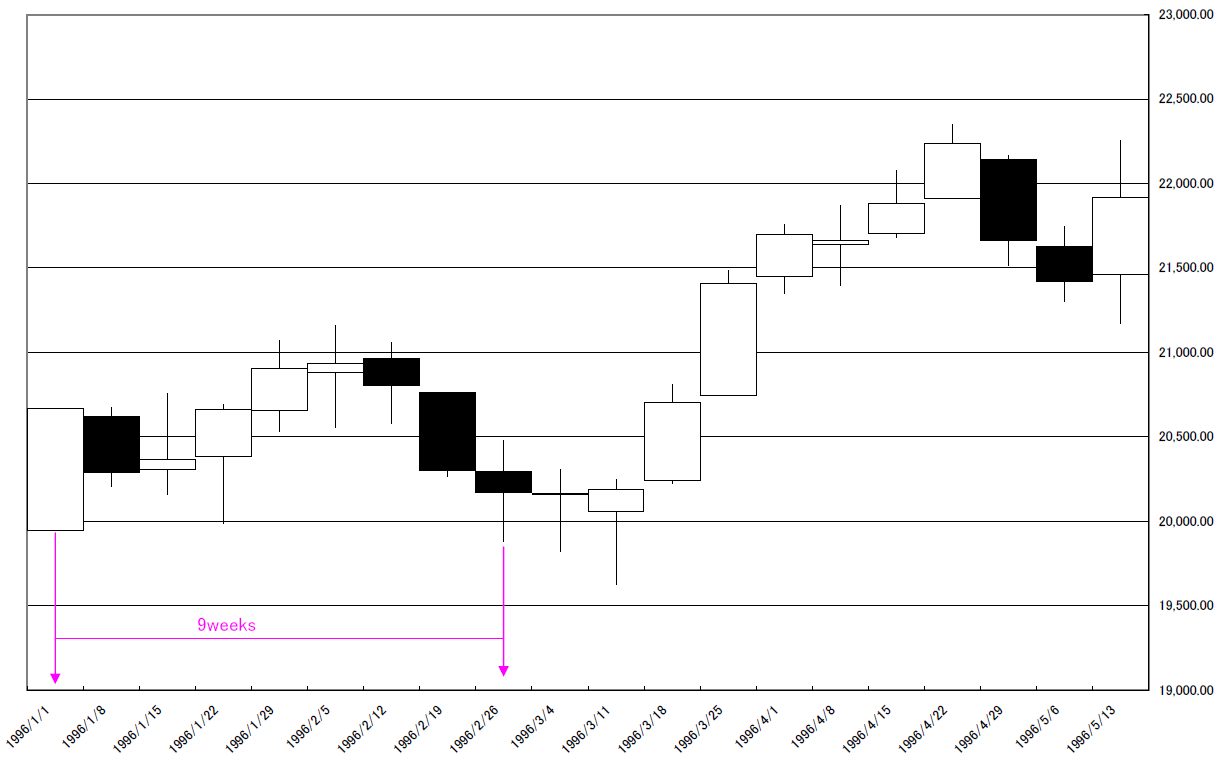
CHART 08 : 1994/12/19
Retar.jpは「羽黒足」を判別するソリューションを開発しました。
ご興味のある方は“Contact Us”からお問い合わせください。
We developed automatic “HAGURO” classify tool.
If you have some interest in it , please “Contact Us”.
相場分析のリクエストがありましたら“Contact Us”からお知らせください。ご要望にお応えできるように努力いたします。
このブログはあくまでも個人的な見解であり、投資判断は各自でお願い致します。当ブログは一切の投資損益に対する責任を負いません。
ホームページに来て下さってありがとうございます。明日もよろしくお願いいたします。
If you have some request to analyze, please write to “Contact Us”.
We do best effort for your request.
These are only personal opinions on this blog, and you need the investment judgment in each one. This blog doesn’t assume the responsibility to all the investment profit and loss.
Thank for watching our contents. My best regards next day.

