
東京マーケット円建て銀日足・もう少し下げると思います。/Tokyo market silver calculated in yen (Daily Data). The market price did not reach the target price.

2011/09/28

本日は東京マーケット円建て銀日足についてです。

Today’s analyze is about Tokyo market silver calculated in yen (Daily Data).


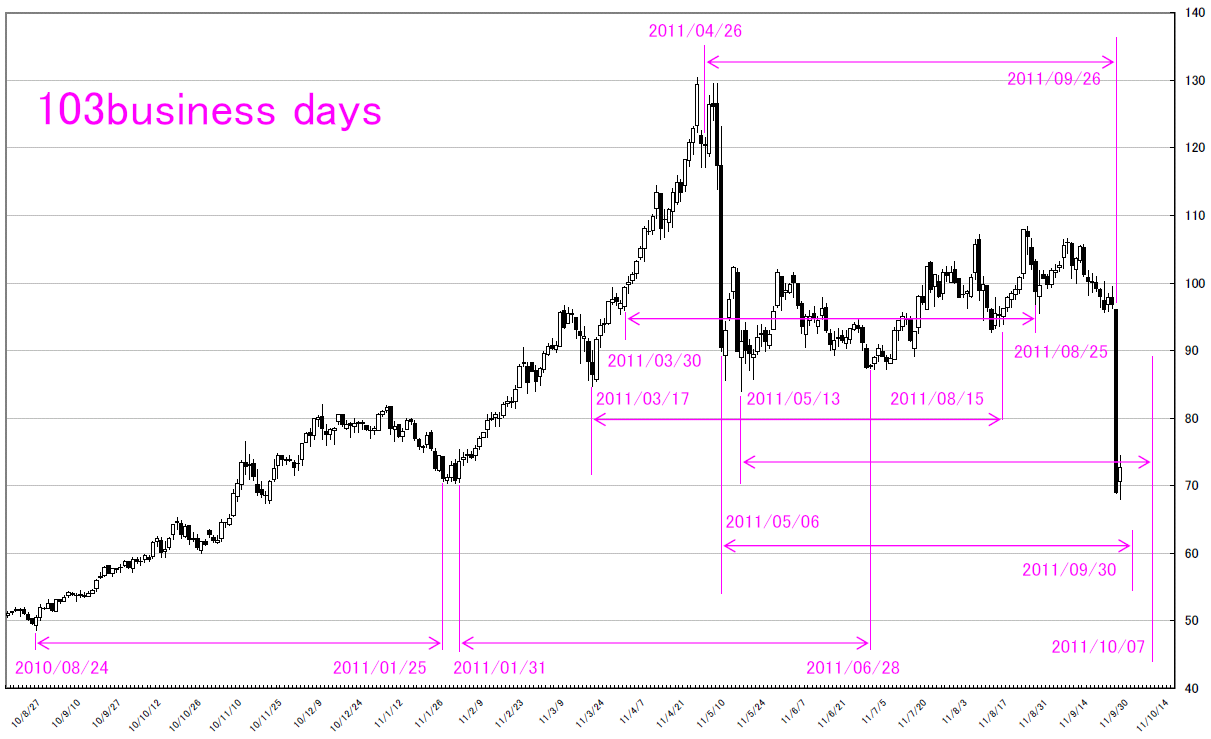
対等数字を求めてみました。

高値-高値、安値-安値には因果関係があるようです。

高値-高値の組み合わせでは82営業日の因果。

安値-安値の組み合わせでは103営業日の因果。

この先の日柄としては、①2011/09/30に安値、②2011/10/07に安値、③2011/10/06に高値をつけやすいであろうと想定されます。

We find out “TAITOU” number.

We can find “cause and effect” in “Combination of High and High price” and “Combination of Low and Low price”.

The “Combination of High and High price” is 82 business days.

The “Combination of Low and Low price” is 103 business days.

So we can calculate the future “HIGARA”; 1. 2011/09/30 may take low price. 2. 2011/10/07 may take low price. 3. 2011/10/06 may take high price.
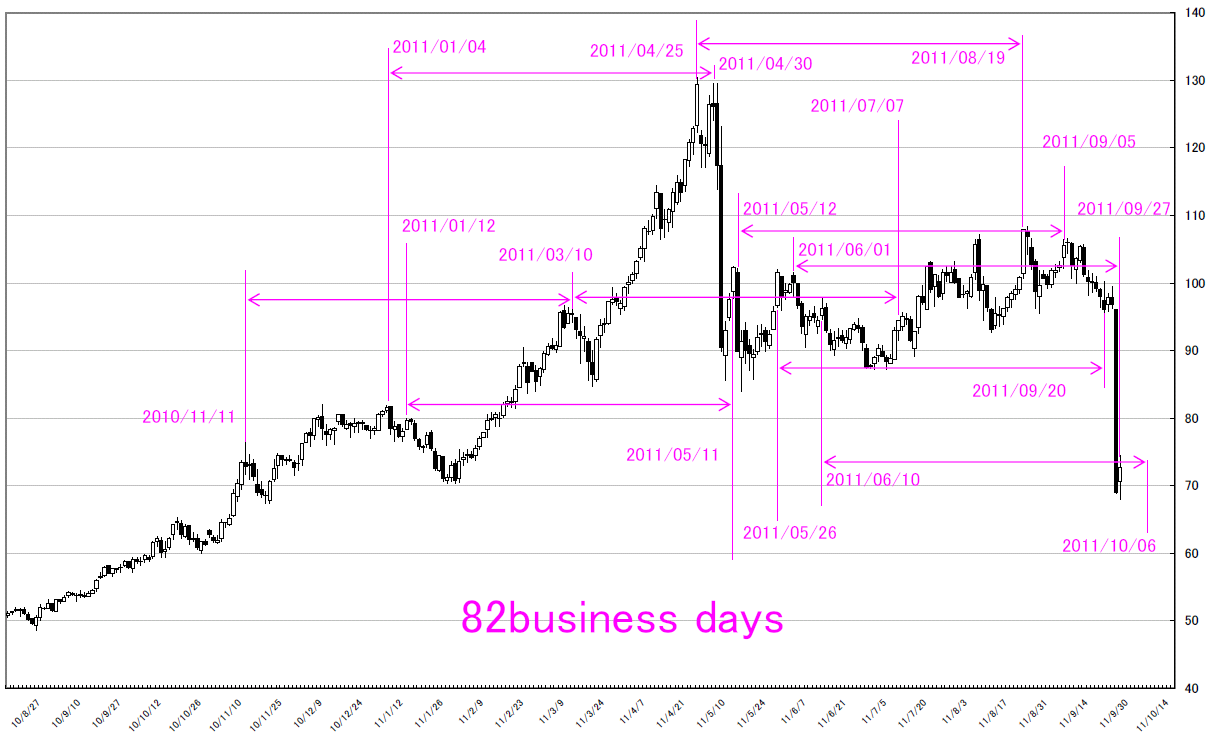
82

103


一目の値幅観測ではもう少し下げないと達成感は出ないと考えられます。

We think the market price do not reach the target price calculated by “ICHIMOKU” way.
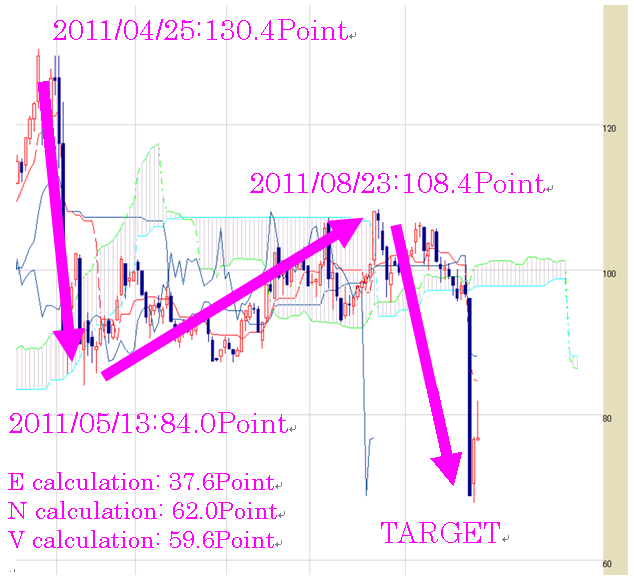
ICHI


1枠1point、3枠転換の終値ポイントアンドフィギュアです。

直近の下げは、13枠持ち合いからのブレークになります。

このため、ターゲットは39枠の移動になりますが、37枠しか達成しておりません。

前回の大きな下げでは、37枠移動しているため(水色)、垂直分析の達成感は出ています。

しかしながら、その後さらに2枠下まで下げていることを考えると、まだ下落余地が残されていると思います。

This is 1 point change and 3 box reversal close price’s Point and Figure chart.

The recent fall is breaking from 13 boxes steadiness.

So, the target price is 39 boxes move, but now the price move 37boxes.

The recent big fall was 37 moves (sky blue), so the market price reaches the target price calculated by vertical method.

But after that, the market price fall 2 boxes; I think the market price may fall more.
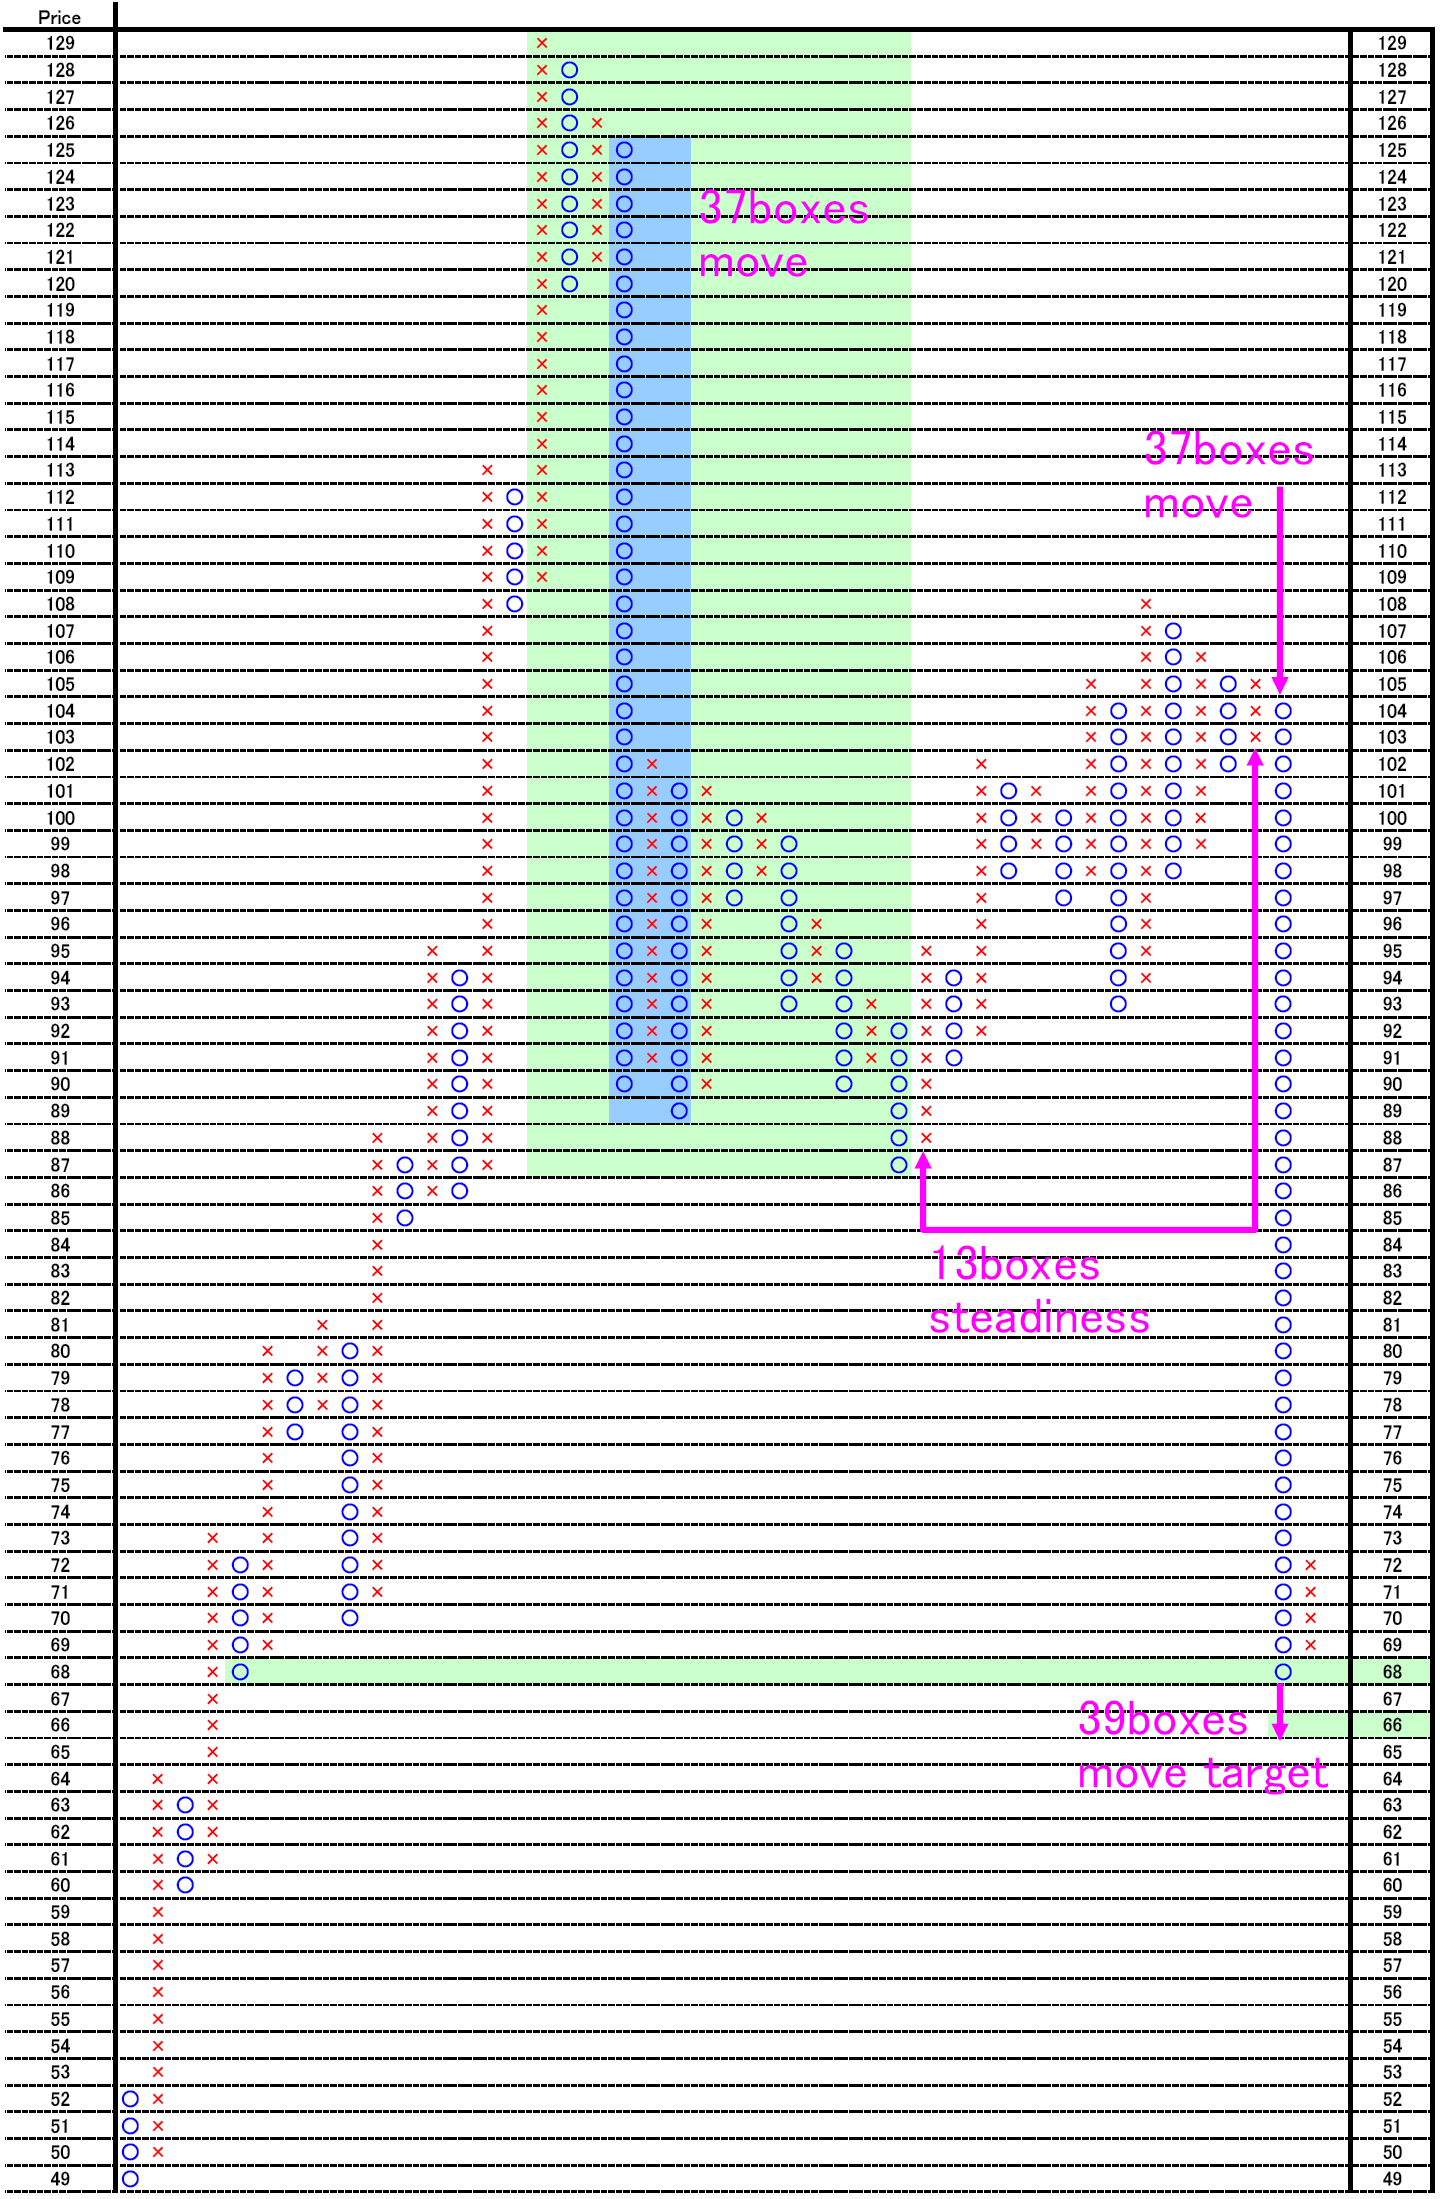
PF


相場分析のリクエストがありましたら“Contact Us”からお知らせください。ご要望にお応えできるように努力いたします。

このブログはあくまでも個人的な見解であり、投資判断は各自でお願い致します。当ブログは一切の投資損益に対する責任を負いません。

ホームページに来て下さってありがとうございます。明日もよろしくお願いいたします。

If you have some request to analyze, please write to “Contact Us”.

We do best effort for your request.

These are only personal opinions on this blog, and you need the investment judgment in each one. This blog doesn’t assume the responsibility to all the investment profit and loss.

Thank for watching our contents. My best regards next day.

チャートを分析し続けること/Why do we analyze the market chart?

2011/09/27

私たちは、北海道の札幌でレポートを書いております。

札幌は、東京からは約1000キロメートル(約600マイル)の彼方の土地です。

ネットが全盛の世の中なので不便は無いように思いますが、田舎に住んでいるというハンディを感じることがあります。

例えば、日経ヴェリタスは、1日遅れて配達されます。優れたアナリストの講演をライブで拝聴することはできません。

私たちはマーケットに携わっておりますが、マーケットの持つ空気感を直接味わうことはできません。

マーケットニュースは、新聞やネットのニュースサイトで得られるもの限られ、特別なニュースに接することができる立場にはありません。

それでも、さほど不便は感じておりません。

ネットのおかげで、最新のBID、ASKを知ることができます。

私たちが北海道札幌でできることは値動きのみに着眼し、チャートを分析し続けること、ただ、それだけなのです。

チャートは相場を雄弁に語ります。

We are writing our report from Hokkaido Sapporo city.

Sapporo is about 1000 km (600 mile) far from Tokyo city.

You may think there are no inconveniences working there because internet environment is equal.

But we sometimes feel “We are living rural”.

For example, “NIKKEI VERITAS” (Japanese famous economic newspaper) is behind for one day and we can not listen to the great analyst’s lecture live.

We execute our market business here, but we can not feel the market undertone.

We can read market news from Newspaper and net news and we can not reach the special market news.

But we do not feel inconvenient so much.

We can get the recent market BID and ASK price.

The only thing what we can do are watching the market price and analyze the market chart.

Market charts imply eloquently.


相場分析のリクエストがありましたら“Contact Us”からお知らせください。ご要望にお応えできるように努力いたします。

このブログはあくまでも個人的な見解であり、投資判断は各自でお願い致します。当ブログは一切の投資損益に対する責任を負いません。

ホームページに来て下さってありがとうございます。明日もよろしくお願いいたします。

If you have some request to analyze, please write to “Contact Us”.

We do best effort for your request.

These are only personal opinions on this blog, and you need the investment judgment in each one. This blog doesn’t assume the responsibility to all the investment profit and loss.

Thank for watching our contents. My best regards next day.

© 2026 Retar