2011/09

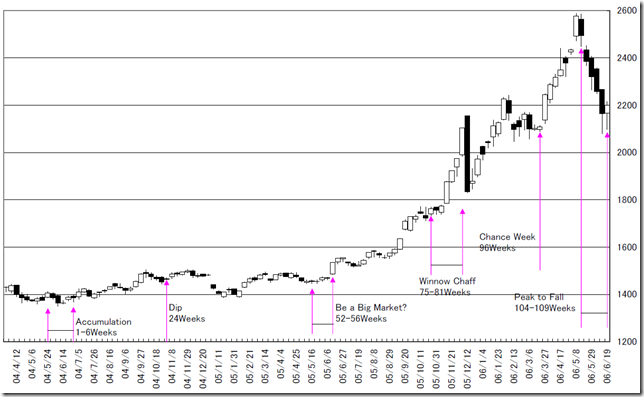
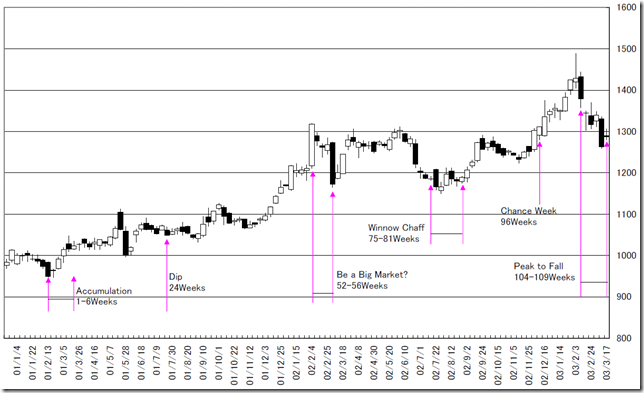
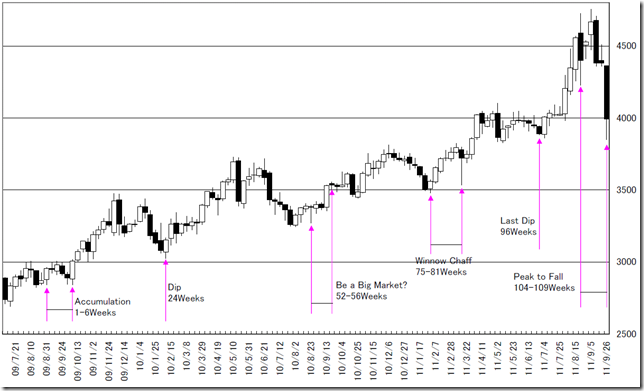
東京金週足。上昇相場104-109サイクル/Tokyo Gold Market weekly data. Bull market 104 – 109 now may be ended?

2011/09/30

本日は東京金週足についてです。

Today we analyze Tokyo Gold Market weekly data.


相場は難しいと改めて感じます。

近年の上昇サイクルを分析しました。

2001年から2003年の上昇相場では、以降87週間の間、新高値を更新できませんでした。

2004年から2006年の上昇相場では、以降40週間の間、新高値を更新できませんでした。

明日以降、今後について考えてみたいと思います。

We feel a market is difficult.

We analyze the recent year’s bull market.

In 2001 – 2003 rallies, the market price can not take new high after 87 weeks.

In 2004 – 2006 rallies, the market price can not take new high after 40 weeks.

We would like to consider future in next report.

01

02

03


相場分析のリクエストがありましたら“Contact Us”からお知らせください。ご要望にお応えできるように努力いたします。

このブログはあくまでも個人的な見解であり、投資判断は各自でお願い致します。当ブログは一切の投資損益に対する責任を負いません。

ホームページに来て下さってありがとうございます。明日もよろしくお願いいたします。

If you have some request to analyze, please write to “Contact Us”.

We do best effort for your request.

These are only personal opinions on this blog, and you need the investment judgment in each one. This blog doesn’t assume the responsibility to all the investment profit and loss.

Thank for watching our contents. My best regards next day.


東京マーケット円建て銀日足・もう少し下げると思います。/Tokyo market silver calculated in yen (Daily Data). The market price did not reach the target price.

2011/09/28

本日は東京マーケット円建て銀日足についてです。

Today’s analyze is about Tokyo market silver calculated in yen (Daily Data).


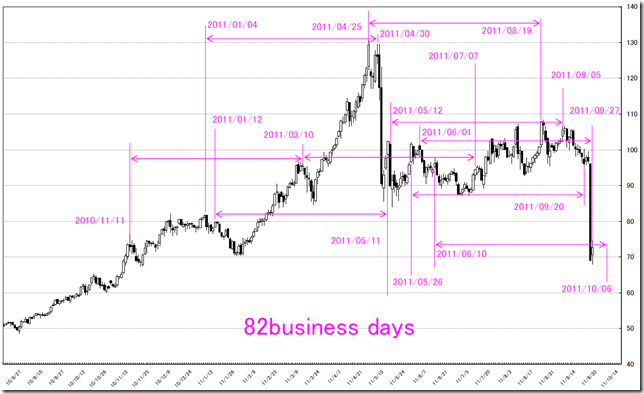
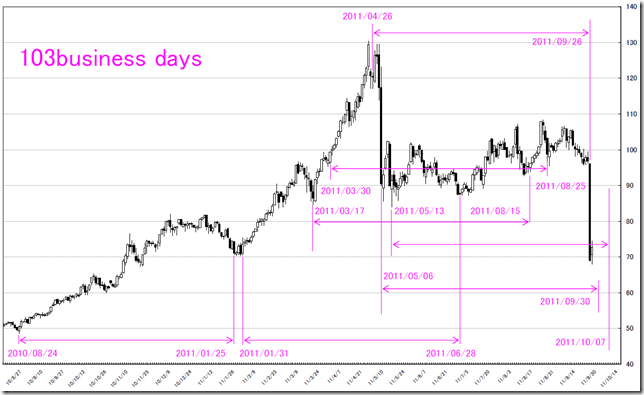
対等数字を求めてみました。

高値-高値、安値-安値には因果関係があるようです。

高値-高値の組み合わせでは82営業日の因果。

安値-安値の組み合わせでは103営業日の因果。

この先の日柄としては、①2011/09/30に安値、②2011/10/07に安値、③2011/10/06に高値をつけやすいであろうと想定されます。

We find out “TAITOU” number.

We can find “cause and effect” in “Combination of High and High price” and “Combination of Low and Low price”.

The “Combination of High and High price” is 82 business days.

The “Combination of Low and Low price” is 103 business days.

So we can calculate the future “HIGARA”; 1. 2011/09/30 may take low price. 2. 2011/10/07 may take low price. 3. 2011/10/06 may take high price.

82

103


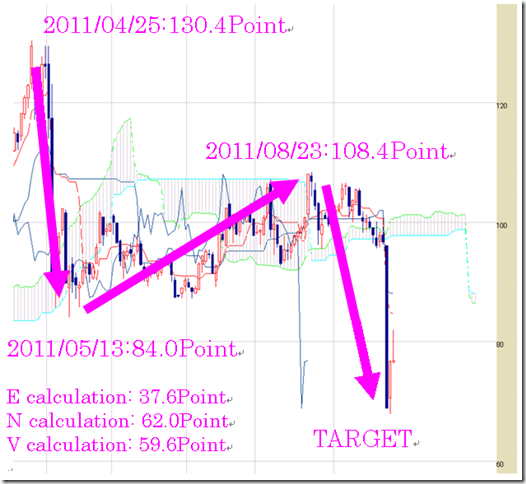
一目の値幅観測ではもう少し下げないと達成感は出ないと考えられます。

We think the market price do not reach the target price calculated by “ICHIMOKU” way.

ICHI


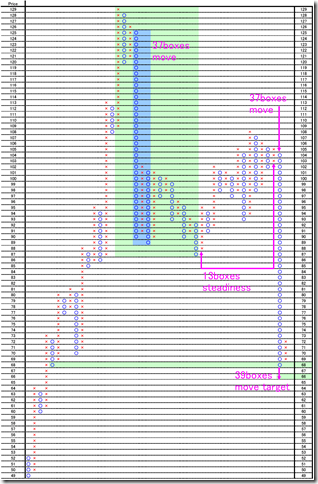
1枠1point、3枠転換の終値ポイントアンドフィギュアです。

直近の下げは、13枠持ち合いからのブレークになります。

このため、ターゲットは39枠の移動になりますが、37枠しか達成しておりません。

前回の大きな下げでは、37枠移動しているため(水色)、垂直分析の達成感は出ています。

しかしながら、その後さらに2枠下まで下げていることを考えると、まだ下落余地が残されていると思います。

This is 1 point change and 3 box reversal close price’s Point and Figure chart.

The recent fall is breaking from 13 boxes steadiness.

So, the target price is 39 boxes move, but now the price move 37boxes.

The recent big fall was 37 moves (sky blue), so the market price reaches the target price calculated by vertical method.

But after that, the market price fall 2 boxes; I think the market price may fall more.

PF


相場分析のリクエストがありましたら“Contact Us”からお知らせください。ご要望にお応えできるように努力いたします。

このブログはあくまでも個人的な見解であり、投資判断は各自でお願い致します。当ブログは一切の投資損益に対する責任を負いません。

ホームページに来て下さってありがとうございます。明日もよろしくお願いいたします。

If you have some request to analyze, please write to “Contact Us”.

We do best effort for your request.

These are only personal opinions on this blog, and you need the investment judgment in each one. This blog doesn’t assume the responsibility to all the investment profit and loss.

Thank for watching our contents. My best regards next day.

© 2024 Retar