分析手法について・その3・トレンドライン編(1)
Our analyzing method Part.3; Trend line method Part 1.
我们的分析方法(3)。趋势线的方法(1)。
本日はトレンドラインの私たちの特徴について説明してみたいと思います。
Today, we explain our unique feature about trend line analysis.
一定のルールの中で引く/Using same rule
トレンドラインは簡単そうに見えて、実は難しい。
理由は簡単であり、裁量の入り込む余地があるからです。
徹底的に手順とルール決めを行えば、裁量の入り込む余地はほぼなくなります。
ここでは、同じ条件でトレンドラインを引く方法について私たちの経験を述べてみたいと思います。
Trend line is easy method but difficult.
The reason is there is much room of discretion.
We need to make complete rules and orders and there will not sit ambiguous room.
Now, we explain our experience of drawing as same condition.
ベースとなるチャートの描き方/Drawing of the base chart
チャートを描くときに重要なことは、ろうそく足を描く本数と値幅を決めることです。
お勧めはギザギザがわかるようにA4の用紙いっぱいに描くことです。
私たちの場合は、ろうそく足の本数は50本、100本、200本、256本を基準にチャートを作成しています。
値幅は安値、高値が上下いっぱいに入るようにしています。
The importance of drawing the chart is how many candle sticks and what price range you will draw.
Our recommending method is made for ZIG-ZAG to be known and drawing to the limit of the paper of A4.
In our method, we contain 50, 100, 200, 256 candle sticks in one chart and make the high price to the top of the paper and the low price to the bottom of the paper.
トレンドラインの太さ/the thickness of the trend line
相場はやはり生き物なので、どうしても完璧にトレンドラインが引けることは少なくなります。
線に一定の幅を持たせて、描くことをお勧めします。
私たちは、どの時間フレームでも一定の幅を決めてラインを引くようにしています。
The market is “Animal” and we can not draw the perfect trend line on the chart.
We recommend drawing some thick trend line.
We draw same thickness trend line on each time frame chart.
大きい時間枠から調査しよう/We should analyze big time frame
トレンドラインを引くためにはできる事なら3段階のタイムフレームが必要だと感じます。
例えば、株式、商品などでは月足、週足、日足の組み合わせ、為替のスキャルピングならば15分足、5分足、1分足です。
We need 3 types of time frame and this is best.
For example, in stock or commodity market, we need monthly, weekly and daily data and in FX scalping, we need 15 minutes, 5 minutes and 1 minute data.
いよいよ線をひく/Now, drawing the trend line
大きい時間枠のチャートに2種類の線を引いていきます。
1.押さえ込まれた値段(水平に2点以上)
2.外郭線で引ける線を引いていきます。
1番目の場合は「トレンドラインじゃない」という批判を受けるかもしれませんが、目の錯覚もあり引くことにしています。
雑念を減らすため同時にやらず個別に引くことがポイントです。
引くときのポイントは以下のとおりです。
- 押さえ込まれた値段(水平に2点以上)
押さえ込まれた値段を水平に引いてみます。
- 外郭線
以下の条件を2つ以上満たすものは、特に強いラインになります。
- 外郭に位置する長く引ける線をひく
ろうそく足10本を超える長さがおおよその目安。長ければ長いほど意味は強くなります。
- 平行に引ける線を探す
チャートをくまなくみつめ、同じ角度でひけるところ探します。
- 3点以上で結ばれる線を探してひく
- 想像線(妄想線)を引く
一番難しい。平行または延長して上昇(下降)を確認できそうなところ考えます。
We draw 2 types of trend line; finding out the peak price and outer trend line.
The first case, you may say “This is not the trend line” but we draw as the same time.
In order to reduce idle thoughts, not doing simultaneously but pulling individually.
Our essences of drawing are under these.
- Drawing the horizontal peak (containing 2 points and more)
Drawing the horizontal peak and you can find out the resistance or support price.
- Outer lines
If they contain 2 or more over condition, it will work as strong line.
- Draw outer line
When we draw a trend line, there need 10 or more over candle sticks.
The longer we draw, the meaning is more important.
- We need to find out the parallel lines.
We need to watch the chart and find out the same degree trend line.
- Drawing the line connected with 3 or more points.
- Drawing the estimated line
This is best difficult. Drawing the parallel line or extend the existing line and confirming the resistance or support points.
日経平均を例に/The example of Nikkei 225
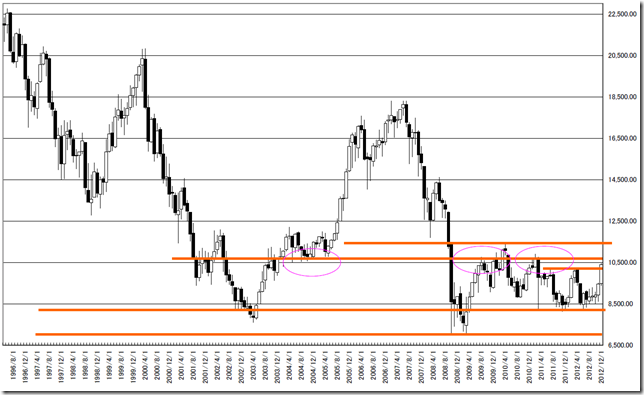
水平に線を引くときはヒゲの先が2箇所以上当たるところ意識して引きます。
ここで理解できることは「10550-10600円付近に強い抵抗帯ありそー。そこまでは値段がのびるかもねー」ということでしょう。
下方向は「8400-8300円ぐらいに抵抗帯だな」と意識する必要があります。
We need to draw horizontal line containing 2 or more over points.
We can know “10550-10600yen may work as resistance point and the market price will jump at that point”.
And lower side, we can find out “8400-8300yen may work as support”.
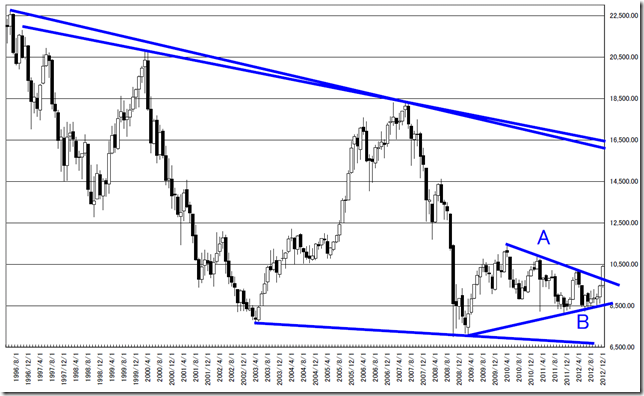
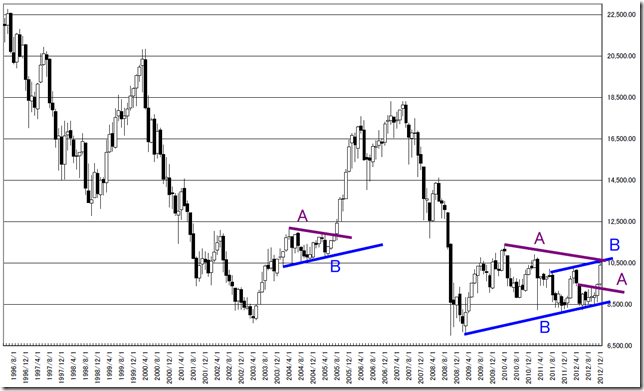
外郭線を引いてみました。
最近の相場はA線を越えたから所から延びました。(レポートでは2012/12/17参照)
「9800円付近にサポートがあるな、もっと下がれば8500円付近にもサポートがあるな」
We draw the outer line.
The recent market, the price jumped from cutting “A” line. (See 12/17/2012 report)
And we can find out “9800yen and 8500yen around may work as support point”.
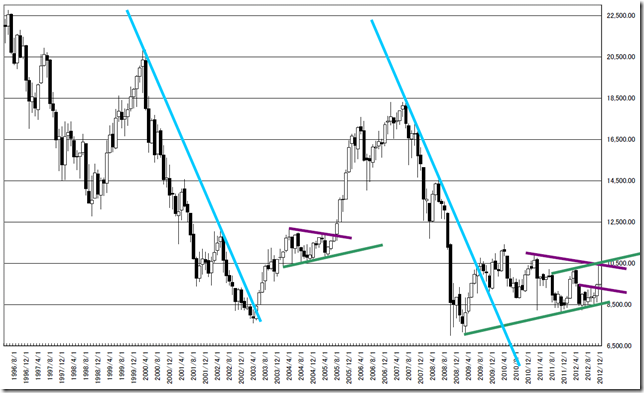
平行線を3種類見つけました。(青、緑、紫)
現在の相場は、過去にも抵抗帯になった角度に押さえ込まれ(紫)、上昇バンド上限に達せずに(緑)越年となりました。
We can find out 3 types of trend lines. (Blue, Green and Purple)
In recent market, the market price was resisted by purple and could not reach the upper side of the band (Green).
3点以上で押さえ込まれる線を引いてみました。
最近の相場はA線を越えたから所から延びました。(レポートでは2012/12/17参照)
We added 3 or more over containing lines.
The recent market, the price jumped from cutting “A” line. (See 12/17/2012 report)
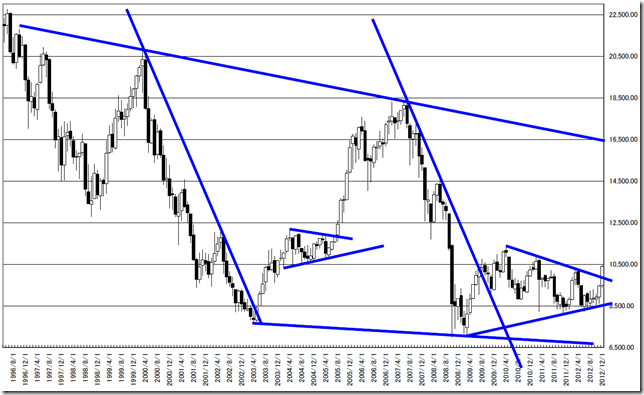
想像線(妄想線)を引いてみました。
想像線(妄想線)にはAのように1点から想像するタイプ(もう、ここしか引けないよね)とBのように2点までは平行となり、3点目を想像するタイプがあります。
先ほどまで引いてきたラインで2本以上平行なラインとして存在し、平行に引けそうなものを全て引いてみます。
また、延長線も引いてみます。
ここから判断できることは「10550-10600円付近に抵抗帯がありそうだね」ということになります。
We draw estimated lines.
There are 2 types of estimated lines; only place to drawing (A) and drawing between 2 points and more and estimating third point.
We add the parallel line pointing 2 or more over and extended lines.
We can find out “There is resistance point at 10550-10600yen”.
結果をまとめる/A result is summarized
ここで、結果を一旦まとめます。
私たちは強弱の順序をつけ、上下方向に2-3箇所を決めていきます。
日経平均をまとめると以下のようになります。
下方向のサポート
8500-8300円付近に複数のサポート(強い)
10000 -9800円付近にも弱いサポート(弱い)
上方向のレジスタンス
10400円付近にレジスタンス到達(弱い)
10500-10600円付近にレジスタンス、2本の想像線が到達(強い)
ここまででも、面倒くさいですね。
明日以降に日足、週足について説明していきます。
We need to summarize here.
We need to take order and determine the two or three resistance and support points.
These are Nikkei 225 summary.
The support point;
8500-8300yen (Strong)
10000 -9800yen (Weak)
The resistance point;
10400yen (Weak)
10500 -10600yen (Strong)
We need much difficulty.
Tomorrow or subsequent days, we introduce how to add trend lines on daily and weekly data.
相場分析のリクエストがありましたら“Contact Us”からお知らせください。ご要望にお応えできるように努力いたします。
このブログはあくまでも個人的な見解であり、投資判断は各自でお願い致します。当ブログは一切の投資損益に対する責任を負いません。
ホームページに来て下さってありがとうございます。明日もよろしくお願いいたします。
If you have some request to analyze, please write to “Contact Us”.
We do best effort for your request.
These are only personal opinions on this blog, and you need the investment judgment in each one. This blog doesn’t assume the responsibility to all the investment profit and loss.
Thank for watching our contents. My best regards next day.

