NY金・一目波動計算・上昇リスクも下落リスクもあるので注意
NY GOLD; it will jump or fall calculated by “ICHIMOKU” wave method.
纽约黄金。“一目均衡表”的波动计算。有上升的风险和下跌的风险。请注意。
皆さんご存知のある投資銀行のレポートです。
「2013年の初頭に金価格の上昇の可能性を見ていましたが、私たちは下値不安を感じています。その結果、金のLONGポジジョンの収益機会が減少しているとみています」
この投資銀行は、時々しゃしゃり出て来て、根拠もなしに、ポジショントークをしているようです。
(大抵は反対のことを言っているようですが・・・)
わたしたちは、根拠のないことは言わないように心がけています。
推測過程における根拠を示し、皆様自身できちんと検証できるように説明しているつもりです。
投資は楽をして儲かるものではありません。
信用できるのは自分だけです。しっかり勉強しましょう。
This is a report of a certain well known investment bank.
“While we see potential for higher gold prices in early 2013, we see growing downside risks. As a result, we find that the risk-reward of holding a long gold position is diminishing,”
This invest bank sometimes offer groundless opinion expressed from their point of view.
(They often say opposite view.)
We take big effort not to say groundless opinion.
We offer the way of estimated process, and you can verify exactly for yourself.
Investment is difficult and not profitable.
What can be trusted are only you.
Let’s study hard.
本日はNY金を分析します。
本日は一目波動計算でみていきます。
いろいろな計算があるので考察してみたいと思います。
Today we analyze NY gold.
We analyze “ICHIMOKU” wave method.
There are some types of calculation.
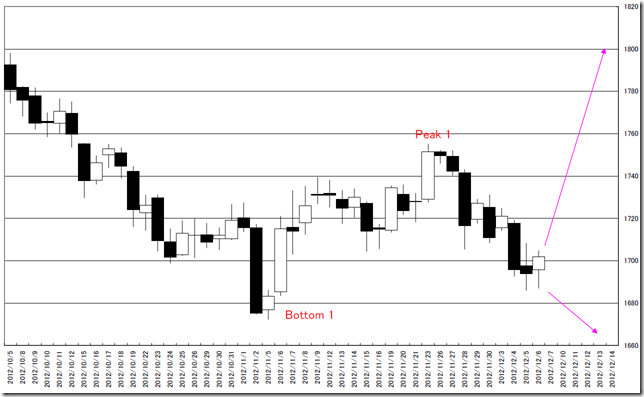
はじめにPeak 1と Bottom 1があり、価格は現在ハラミとなっていることがわかります。
このハラミのブレーク方向こそ、次期トレンドであり、私たちは月末ごろに発生すると見ています。(2012/12/05レポート)
The market price exists between “Peak1” and “Bottom1”.
We think the breaking direction is next trend and we can find out at the end of this month. (See 12/05/2012 report)
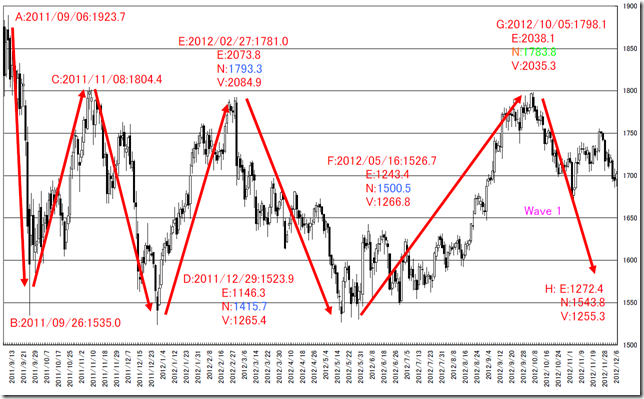
長期的な波動計算です。
G地点でN計算値を上回っていることが確認できます。
計算値を超えてきているため、「上伸すること」がファーストセオリーになります。
And next is long term wave calculation.
The market price went over N calculation value; the first theory we need to consider is upper side risk.
「Wave1を1つの波動とみるのは乱暴だ」
まったくそのとおりです。
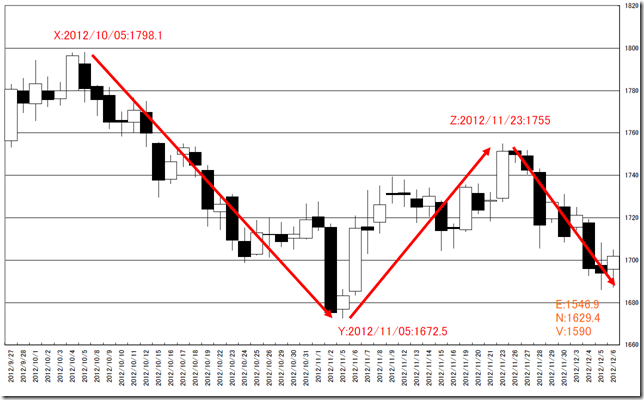
Y地点で押しを入れZ地点で新高値(Xを超える)を取れなかったということは、下げ波動ではないかという意見も言えます。
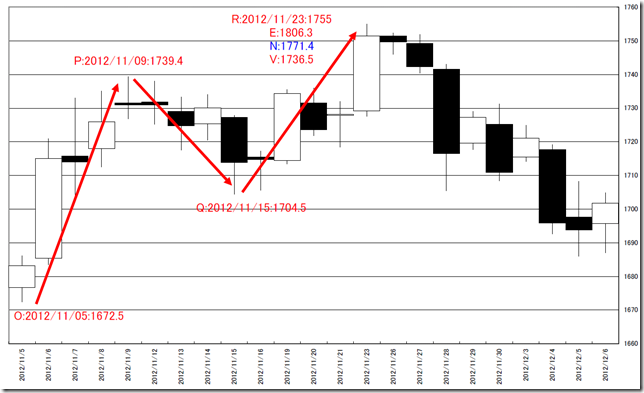
その根拠として、R地点が十分な価格に達成せず下落していることも十分な根拠になります。
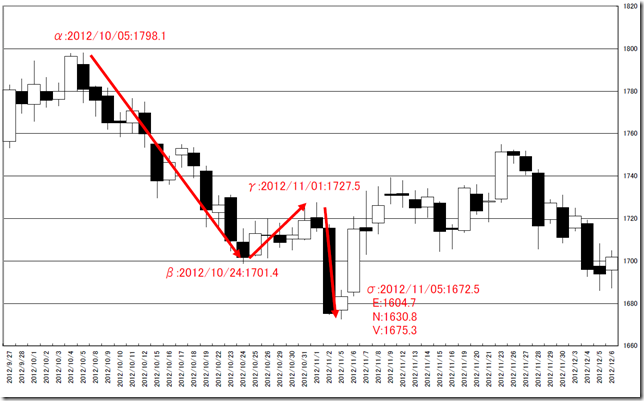
さらにσの値もターゲットを下回っています。
G地点以降、上げ波動は弱く、下げ波動が強いことが確認できます。
And you may say “It is too rough treating “Wave1” as one wave”.
We think so.
The market price made a dip at “Y” point and could not take new high; we can say this is down side wave.
And “R” point can not reach the target price and has already reversed.
Moreover, the market price went lower than target price at “SIGMA” point.
We can confirm upper side wave was weak and down side wave was strong after “G” point.
結論として、大きな波動の中では上げ基調、短期的には下げ圧力が強く、下値試しをしている最中とみることができます。
上にも下にも跳ねるリスクがあります。
楽しみな月ですね。
As the conclusion, the market wave is bullish in long term and now seeking the bottom.
We think there are two side risks.
This month is very exciting.
相場分析のリクエストがありましたら“Contact Us”からお知らせください。ご要望にお応えできるように努力いたします。
このブログはあくまでも個人的な見解であり、投資判断は各自でお願い致します。当ブログは一切の投資損益に対する責任を負いません。
ホームページに来て下さってありがとうございます。明日もよろしくお願いいたします。
If you have some request to analyze, please write to “Contact Us”.
We do best effort for your request.
These are only personal opinions on this blog, and you need the investment judgment in each one. This blog doesn’t assume the responsibility to all the investment profit and loss.
Thank for watching our contents. My best regards next day.

