米ダウ工業株 : 美国道琼斯 : Dow Jones Industrial Average

米ダウ工業株週足・羽黒足分析・近いうちに15855.12ポイントを割り込む可能性大/Dow Jones Industrial Average (^DJI) weekly; the market price will cut 15855.12point sooner; “HAGURO” (Japanese traditional method) whispers tail risk. /道琼斯工业平均指数。羽黑足分析。在近期内市场价格将下调15855.12点。

2014/11/03

米ダウ工業株週足・羽黒足分析・近いうちに15855.12ポイントを割り込む可能性大

Dow Jones Industrial Average (^DJI) weekly; the market price will cut 15855.12point sooner; “HAGURO” (Japanese traditional method) whispers tail risk.

道琼斯工业平均指数。羽黑足分析。在近期内市场价格将下调15855.12点。


本日は米ダウ工業株週足についてです。

結論は「山高く谷深し」。

日本古来のテクノロジーである羽黒足はテールリスクを囁いています。

Today’s analyze is Dow Jones Industrial Average (^DJI) weekly.

Our conclusion is “The peak will be higher and the bottom will be lower”. (Japanese Saying)

“HAGURO” (Japanese traditional method) whispers tail risk.


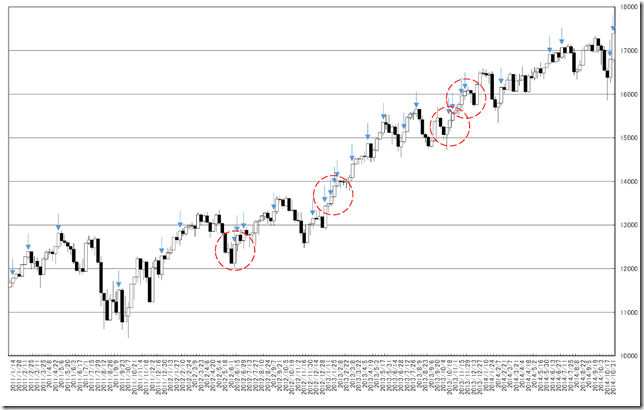
今週の週足線では羽黒4号線となりました。

200週で29回出現しています。

2週連続して発生した羽黒2号線となり、今週は上値がありそうです。(赤丸)

In this week, the market price formed “HAGURO” No. 4 formation.

In past 200 weeks, it appeared 29 times.

The market price formed this formation past two weeks and this week will be rally. (Red circle)

CHART1


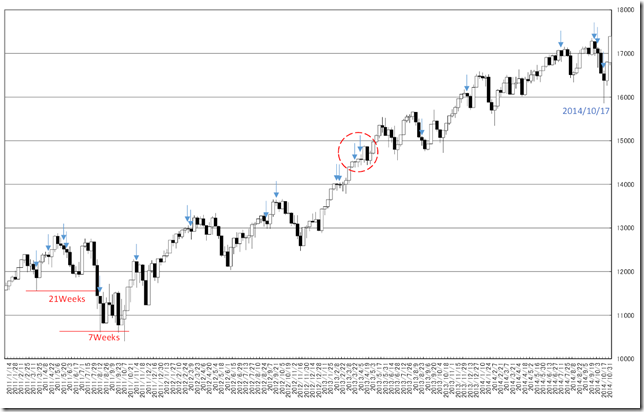
ところが、2014/10/17の週に羽黒9号線が発生していました。

過去200週で羽黒9号線と10(14)号線は20回発生しており、数週のうちに下値を舐めています。

下値を舐めた最大は21週後、例外は20例中2例しかありません(赤丸)。

下値を舐めるとは15855.12ポイントを割り込むことであり、先週の終値は17390.52ポイント。

その差は1535.4ポイントであり、更に今週は上げる可能性が高い状況です。

But the market price formed “HAGURO” No. 9 formation in 10/17/2014 week.

After this formation, the market price took lower for several weeks.

The latest pattern was after 21 weeks and the exception is 2 pattern in 20 occasions.

Taking lower means cutting 15855.12 point and last week close price was 17390.52 point.

The difference is 1535.4 point (too big) and the possibility of jumping this week will be very high.

CHART2


相場分析のリクエストがありましたら“Contact Us”からお知らせください。ご要望にお応えできるように努力いたします。

このブログはあくまでも個人的な見解であり、投資判断は各自でお願い致します。当ブログは一切の投資損益に対する責任を負いません。

ホームページに来て下さってありがとうございます。明日もよろしくお願いいたします。

If you have some request to analyze, please write to “Contact Us”.

We do best effort for your request.

These are only personal opinions on this blog, and you need the investment judgment in each one. This blog doesn’t assume the responsibility to all the investment profit and loss.

Thank for watching our contents. My best regards next day.

如果您需要行情分析,请点击“Contact Us”联系我们。我们将尽力满足您的要求。

本博客仅为个人意见,请各自做出投资判断。本博客概不对任何投资盈亏负责。

感谢您访问本博客。欢迎再次使用。


米ダウ工業株とS&P500比較・2005年相場のような特徴発生/Dow Jones Industrial Average (^DJI) and S&P500; Latest market is similar to 2005 market. /比较道琼斯工业平均指数和标普500指数。这些市场类似于2005年的市场。

2014/08/27

米ダウ工業株とS&P500比較・2005年相場のような特徴発生

Dow Jones Industrial Average (^DJI) and S&P500; Latest market is similar to 2005 market.

比较道琼斯工业平均指数和标普500指数。这些市场类似于2005年的市场。


本日は過去1000週にわたるS&P500とDJIの特徴を考えてみます。

本日はRetar.jpで開発したINDEXを使用し比較します。

Today, we compare S&P500 and DJI character in past 1000 weeks.

We compare them using our unique INDEX.

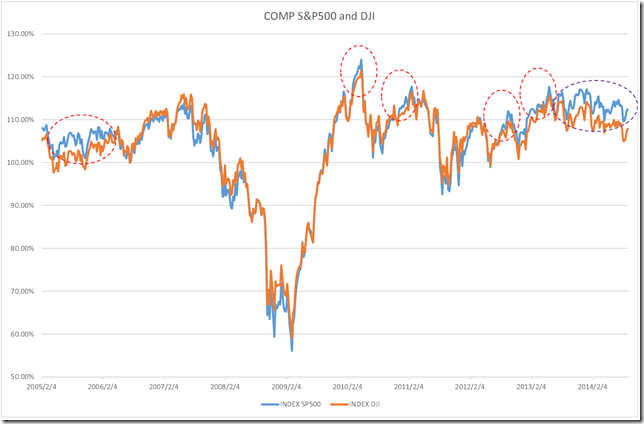
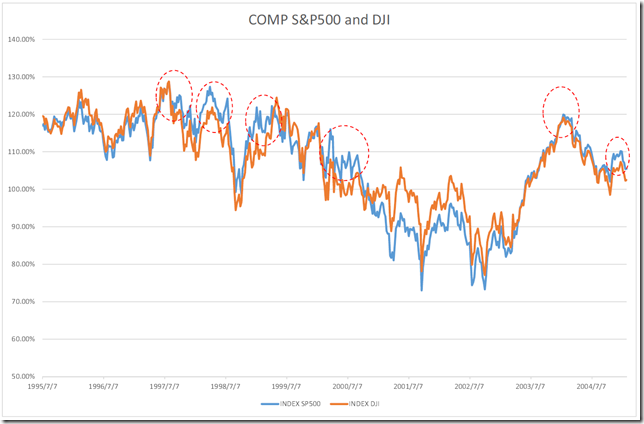
チャートからは傾向として、DJIの上げ下げとS&P500は歩調を合わせていることがわかります。

上昇局面を過ぎるとS&P500がDJIよりもアウトパフォームする傾向があるようです。(赤丸)

その後、パフォーマンスは追いついてきます。

直近でS&P500が長期にわたり、アウトパフォームした局面は、2005年ごろです。

現在も同じ傾向があり、DJIのパフォーマンスが追随することが予想されます。

From the chart, we can find out S&P500 and DJI follow its performance.

After bull market, S&P500 often outperform. (Red circle)

And DJI follow its performance after that.

The recent market and 2005 market is very similar; S&P500 was outperformed for long term.

And we can estimate DJI will follow its performance in future.

01

02


相場分析のリクエストがありましたら“Contact Us”からお知らせください。ご要望にお応えできるように努力いたします。

このブログはあくまでも個人的な見解であり、投資判断は各自でお願い致します。当ブログは一切の投資損益に対する責任を負いません。

ホームページに来て下さってありがとうございます。明日もよろしくお願いいたします。

If you have some request to analyze, please write to “Contact Us”.

We do best effort for your request.

These are only personal opinions on this blog, and you need the investment judgment in each one. This blog doesn’t assume the responsibility to all the investment profit and loss.

Thank for watching our contents. My best regards next day.

如果您需要行情分析,请点击“Contact Us”联系我们。我们将尽力满足您的要求。

本博客仅为个人意见,请各自做出投资判断。本博客概不对任何投资盈亏负责。

感谢您访问本博客。欢迎再次使用。

© 2025 Retar