米ダウ工業株 : 美国道琼斯 : Dow Jones Industrial Average

米ダウ工業株週足・2012/08/27の週、2012/09/15の週が変化週になるかどうかに注目/ Dow Jones Industrial Average (^DJI) Weekly. We need to watch 08/27/2012 week and 09/15/2012 week will become “HENKABI” week or not. /道琼斯工业平均指数。我们需要观察2012年8月27日一周,2012年9月15日一周,将成为“変化日”一周或不。

2012/08/11

米ダウ工業株週足・2012/08/27の週、2012/09/15の週が変化週になるかどうかに注目/ Dow Jones Industrial Average (^DJI) Weekly. We need to watch 08/27/2012 week and 09/15/2012 week will become “HENKABI” week or not.

道琼斯工业平均指数。我们需要观察2012年8月27日一周,2012年9月15日一周,将成为“変化日”一周或不。


本日は米ダウ工業株週足についてです。

チャートというのは後から考えると芸術的な挙動をしているということになります。

Today’s analyze is Dow Jones Industrial Average (^DJI) weekly.

We think the chart is the art and beautiful.

PF


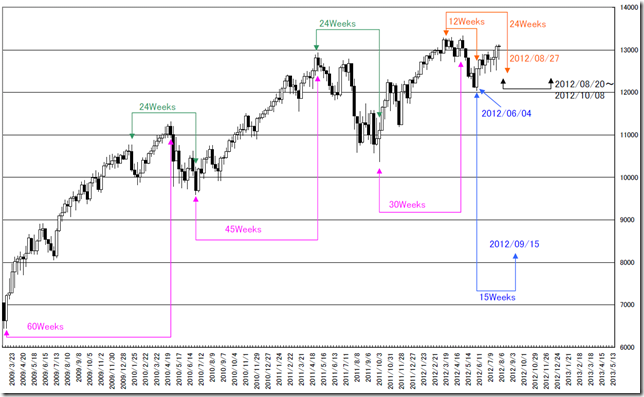
2009/03/09の週以降のチャートです。

はじめに過去の2回の相場を振り返ります。

底値から15週の倍数で高値をとりにきていることがわかります。(ピンク)

そこからの深い押しは高値圏からの24週以内でした。(緑)

This is the DJI weekly chart after 03/09/2012.

We remind twice past market.

We can see the market took high in every multiples of 15. (See pink)

And the market dip took less than 24 weeks. (See green.)


今回も同じような状況が適合するという仮定で、今度は現在の相場に当てはめてみます。

高値圏の開始は2012/03/12の週から2012/04/30の週です。

ここからの24週後の範囲というのは、2012/08/20の週から2012/10/08の週の範囲です。

2012/03/12の週以降から換算すると最大で2012/10/08の週までの間に底を取りにくると考えるのが妥当になります。(黒)

ここから2つのシナリオを考えてみたいと思います。

We apply this hypothesis to recent market.

The high price period is during 03/12/2012 week to 04/30/2012 week.

And the period of 24 weeks after is during 08/20/2012 week to 10/08/2012 week.

At most, the market price will take the major dip by 10/08/2012 week. (See black)

And we suggest two future stories.

2012/06/04の週が深い押し点であった場合/06/04/2012 became a major dip.

マーケットは2012/06/04の週に押しが入りました。

ここからの12週前は2012/03/26の週になります。

2012/03/26を高値圏からの基点として、24の半分で底をとったので納得の大底だったのかもしれません。

ならば、60から15ずつ減らして現在に至ったのですから、2012/06/04からの15週後である2012/09/15の週は大天井の可能性があります。(青)

また、2012/08/27の週は安値圏になる可能性が出てきます。(オレンジ)

2012/08/27の週、2012/09/15の週が変化週になれば、この仮説は正しいことになります。

In 06/04/2012, the market price made a dip.

And 12 weeks before is 03/26/2012 week.

The 03/26/2012 became the major top and it took half of 24 weeks; this is reasonable.

And the market price may take the major high in 09/15/2012; 15 weeks after from the major bottom. (See blue.)

And 08/27/2012 week may become the lower period. (See orange.)

The way to confirm this hypothesis is 08/27/2012 week and 09/15/2012 week will become “HENKABI” week or not.


2012/06/04の週が深い押し点ではなかった場合/06/04/2012 do not became a major dip.

2012/10/08の週までのどこかで深い押しとなるパターンです。

大天井は新たな底からの15週後ということになります。

The market will take the bottom point before 10/08/2012.

The highest will take 15 weeks later after that new bottom.


相場分析のリクエストがありましたら“Contact Us”からお知らせください。ご要望にお応えできるように努力いたします。

このブログはあくまでも個人的な見解であり、投資判断は各自でお願い致します。当ブログは一切の投資損益に対する責任を負いません。

ホームページに来て下さってありがとうございます。明日もよろしくお願いいたします。

If you have some request to analyze, please write to “Contact Us”.

We do best effort for your request.

These are only personal opinions on this blog, and you need the investment judgment in each one. This blog doesn’t assume the responsibility to all the investment profit and loss.

Thank for watching our contents. My best regards next day.


米ダウ工業株日足・2012/04/11が新たな基点か?/Reminding Dow Jones Industrial Average (^DJI) Daily. We think 04/11/2012 will become the new market cycle basis./米道氏工业股是不是2012年4月11日新的基点?

2012/08/07

米ダウ工業株日足・2012/04/11が新たな基点か?

Reminding Dow Jones Industrial Average (^DJI) Daily. We think 04/11/2012 may become the new market cycle basis.

米道氏工业股是不是2012年4月11日新的基点?


本日は米ダウ工業株日足についてです。

Today’s analyze is Dow Jones Industrial Average (^DJI) daily.


日柄には尻尾があります。

尻尾をつかまえると、日柄をみつけることができますが、尻尾は時々、忽然と姿を消すことがあります。

それは相場の地合が変化することを示唆することであり、そうした囁きをチャートから見出す必要があります。

We think “HIGARA” has an animal tail. (Tail means the foot prints or obvious evidence.)

When we take the “tail” and find out the “HIGARA”.

But “HIGARA” often disappear suddenly.

This is the message of the market environ change and we need to find out the whisper.

01


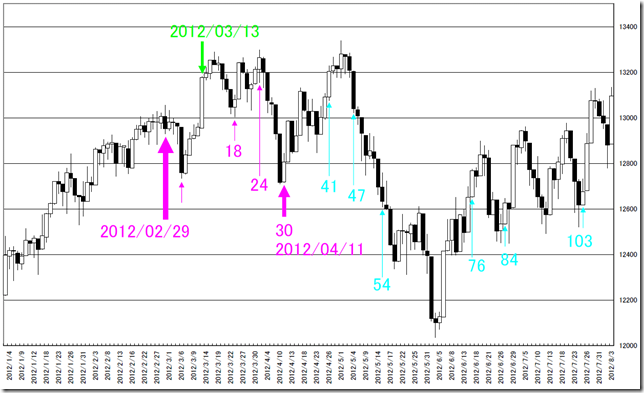
2012/03/09のレポートを振り返ります。

このレポートで想定した日柄をチャートに書き入れてみました。

重要な特徴は以下の2点です。

  • 2012/04/11を境にピークの位置に乱れが生じていることです。
  • 2012/03/13に2012/02/29の高値を抜いたことです。(2012/03/18レポート参照)

私たちは2012/03/18のレポートでシナリオからズレ生じたため「米ダウ工業株日足・仕切り直し必要」というレポートを出しました。

「なぞる行為」が少しでも狂うなら、それは見立ての狂いであり、修正が必要になります。

2012/03/13の大陽線は「尻尾を隠します」という警告であり、「相場を休みなさい」とチャートが囁いた瞬間だったのです。

We remind our 03/09/2012 report.

And we add the points of the guessed peak point.

The important conclusions are under these.

  • The peak points were disordered after 04/11/2012.
  • In 03/13/2012, the market price went over 02/29/2012 high. (See 03/18/2012 report)

So we reported “Dow Jones Industrial Average (^DJI) Daily. We need getting fresh start” in 03/18/2012.

When our estimated story may break a little bit, we need to rebuild our story.

Remind 03/13/2012 big white body candle stick, this was the “chart alerts” and the best time of the stop trading.

02


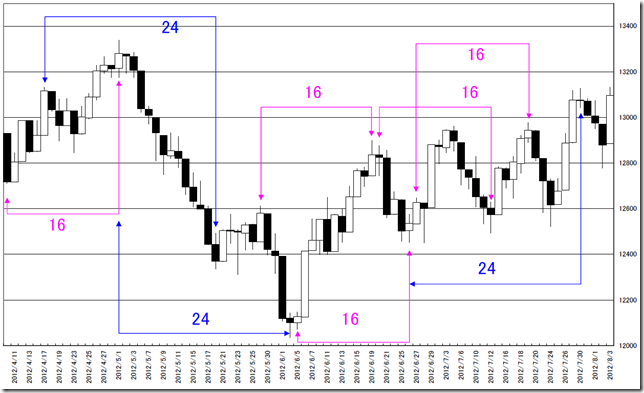
日柄が「尻尾を隠した」以上、次に現れた日柄の特徴を抽出する必要があります。

基点はピークのずれを生じはじめた2012/04/11だと考えております。

基点から見てみると、16、24営業日(8の倍数)をキーワードにした日柄がみえてきます。

When the market conceals “HIGARA”, we need to find out next “HIGARA” unique character.

We think the next basis point may be 04/11/2012.

And we can see 16 and 24 business day’s “HIGARA”; the multiple of 8 may become the next keyword.


相場分析のリクエストがありましたら“Contact Us”からお知らせください。ご要望にお応えできるように努力いたします。

このブログはあくまでも個人的な見解であり、投資判断は各自でお願い致します。当ブログは一切の投資損益に対する責任を負いません。

ホームページに来て下さってありがとうございます。明日もよろしくお願いいたします。

If you have some request to analyze, please write to “Contact Us”.

We do best effort for your request.

These are only personal opinions on this blog, and you need the investment judgment in each one. This blog doesn’t assume the responsibility to all the investment profit and loss.

Thank for watching our contents. My best regards next day.

© 2025 Retar