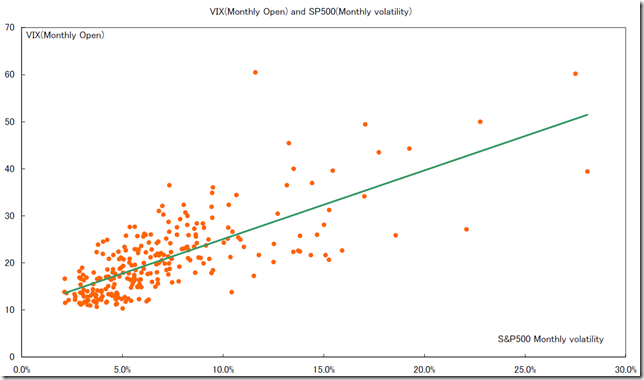
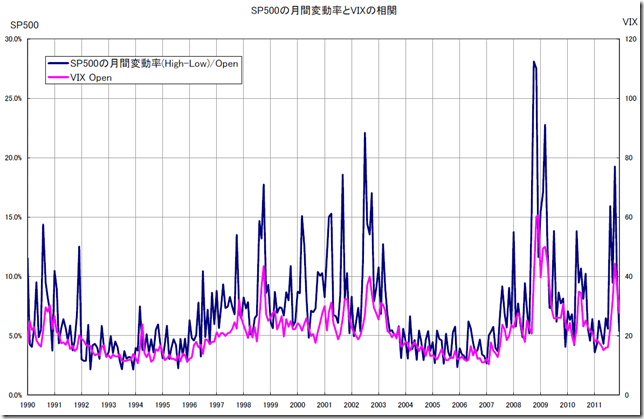
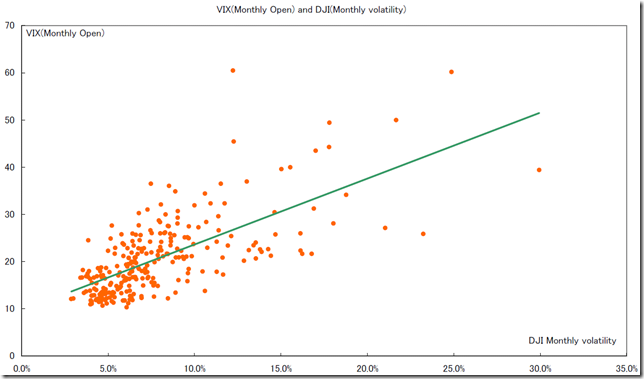
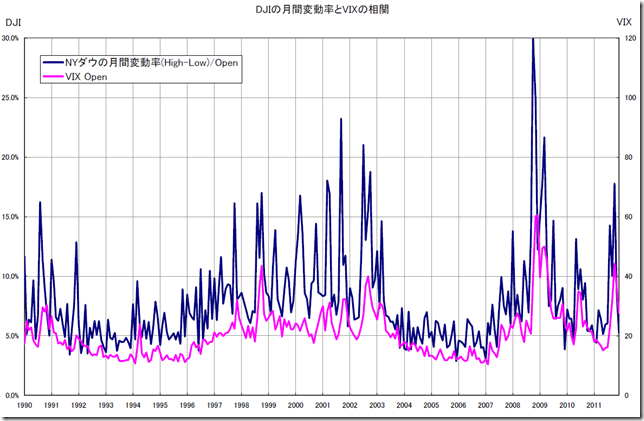
本日は日経ヴェリタス2012/01/08号14Pの記事「株式投資はインフレの備えに」(アンドレ・F・ベロイド博士)の中の一部「月初のVIXが高いと、その月のS&P500株価指数の変動幅が大きくなるとの研究結果が出ています」を検証します。
Today, we validate the article “We need the stock investing for future inflation” (Dr. Andre F. Perold) of “NIKKEI VERITAS 01/08/2011 issue 14Page”.
And we validate the part of “If the VIX monthly open price is higher, the S&P 500 volatility is bigger”.
調査方法はVIXの月初のOPENと月間株価変動率を比較しました。
「S&P500とVIX」「ダウとVIX」は1990年1月から2011年12月までの月足を比較しています。
S&P500とVIXの共分散は0.24。
ダウとVIXの共分散は0.22。
S&P500とVIXの方がより相関関係にあるといえます。
”やや相関がある”程度の正の相関関係なので、直ちにトレードに生かせるものではないと思います。
We checked the relation of the VIX monthly open price and the index monthly volatility.
We compared “S&P500 and VIX” and “DJI and VIX” monthly data from 01/1990 to 12/2011.
The covariance of “S&P500 and VIX” is 0.24.
The covariance of “DJI and VIX” is 0.22.
The conclusion these are weak positive correlation, so we can not suggest some effective trading tactics.
|
-1 ~ -0.7 |
強い負の相関/Strongest Negative Correlation |
|
-0.7 ~ -0.4 |
かなりの負の相関/Some Negative Correlation |
|
-0.4 ~ -0.2 |
やや相関あり/A little Negative Correlation |
|
-0.2 ~ 0 |
ほとんど相関なし/No Correlation |
|
0 ~ 0.2 |
ほとんど相関なし/No Correlation |
|
0.2 ~ 0.4 |
やや相関あり/A little Positive Correlation |
|
0.4 ~ 0.7 |
かなりの正の相関/Some Positive Correlation |
|
0.7 ~ 1 |
強い正の相関/Strong Positive Correlation |
相場分析のリクエストがありましたら“Contact Us”からお知らせください。ご要望にお応えできるように努力いたします。
このブログはあくまでも個人的な見解であり、投資判断は各自でお願い致します。当ブログは一切の投資損益に対する責任を負いません。
ホームページに来て下さってありがとうございます。明日もよろしくお願いいたします。
If you have some request to analyze, please write to “Contact Us”.
We do best effort for your request.
These are only personal opinions on this blog, and you need the investment judgment in each one. This blog doesn’t assume the responsibility to all the investment profit and loss.
Thank for watching our contents. My best regards next day.

