本日は米ダウ工業株週足についてです。
Today’s analyze is Dow Jones Industrial Average (^DJI) weekly data.
先週末は羽黒12号線を出しました。
羽黒12号線は後々の暴騰暴落を示唆します。
2000年以降に15回出しておりますが、2008年以降の出現回数は10回と、波乱の相場で出てくる足です。
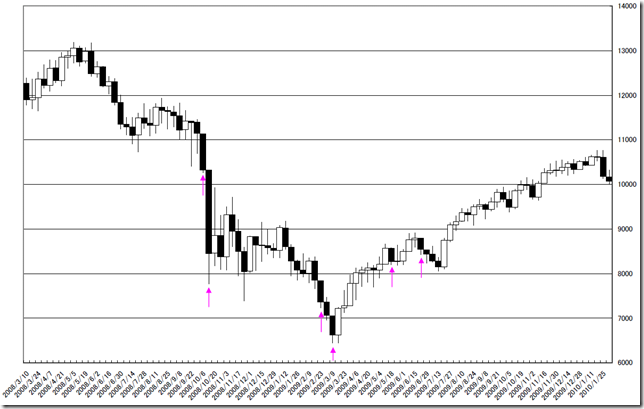
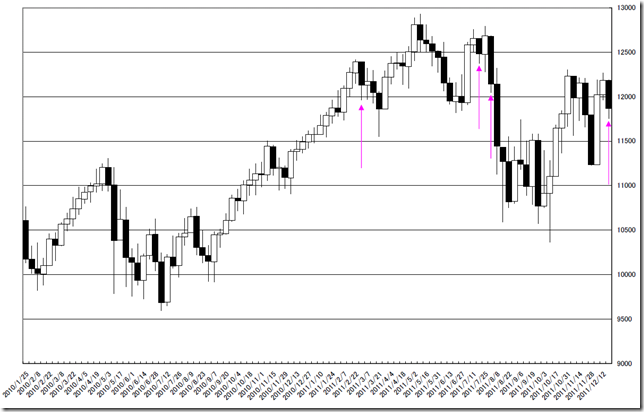
下の図は2000年以降羽黒12号線が現れた週足です。
Last week, DJI appeared “HAGURO 12” candlestick.
The “HAGURO 12” candlestick implies a future sharp decline or sharp rise.
After year 2000, these types of candle stick appear 15 times.
And especially, these types of candlestick appear 10 times after year 2008 volatile market.
Under this table suggests the weeks of “HAGURO 12” candlestick appearing.
|
Date |
Open |
High |
Low |
Close |
|
2011/12/12 |
12181.08 |
12187.1 |
11753.77 |
11866.39 |
|
2011/7/25 |
12679.72 |
12682.97 |
12044.21 |
12143.24 |
|
2011/7/11 |
12655.77 |
12655.77 |
12374.75 |
12479.73 |
|
2011/2/22 |
12389.74 |
12394.7 |
11960.62 |
12130.45 |
|
2009/6/15 |
8798.5 |
8798.5 |
8421.46 |
8539.73 |
|
2009/5/11 |
8569.23 |
8574.88 |
8206.67 |
8268.64 |
|
2009/3/2 |
7056.48 |
7056.48 |
6443.27 |
6626.94 |
|
2009/2/17 |
7845.63 |
7845.63 |
7226.29 |
7365.67 |
|
2008/10/6 |
10322.52 |
10322.52 |
7773.71 |
8451.19 |
|
2008/9/29 |
11139.62 |
11139.62 |
10261.75 |
10325.38 |
|
2006/6/5 |
11247.55 |
11259.96 |
10726.15 |
10891.92 |
|
2003/9/22 |
9641.8 |
9641.87 |
9257.99 |
9313.08 |
|
2003/3/24 |
8514.82 |
8514.82 |
8070.77 |
8145.77 |
|
2002/5/20 |
10348.93 |
10357.44 |
10004.41 |
10104.26 |
|
2001/3/12 |
10638.52 |
10638.63 |
9720.17 |
9823.41 |
相場分析のリクエストがありましたら“Contact Us”からお知らせください。ご要望にお応えできるように努力いたします。
このブログはあくまでも個人的な見解であり、投資判断は各自でお願い致します。当ブログは一切の投資損益に対する責任を負いません。
ホームページに来て下さってありがとうございます。明日もよろしくお願いいたします。
If you have some request to analyze, please write to “Contact Us”.
We do best effort for your request.
These are only personal opinions on this blog, and you need the investment judgment in each one. This blog doesn’t assume the responsibility to all the investment profit and loss.
Thank for watching our contents. My best regards next day.


