本日はシカゴ・オプションVIX(恐怖心理指数)の日足を分析しています。
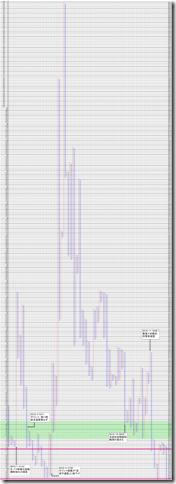
1枠0.1pt、3枠転換の終値ポイントアンドフィギュアです。
2010/1/1から昨日までのデータで作成しています。
Today, we analyze Chicago Options: ^VIX daily rate.
This is 0.1pt change and 3 box reversal close price’s Point and Figure chart.
We make it from 2010/1/1 to last day’s rate.
18ポイントを超えていく部分と18ポイント以下に戻ってくる部分の材料は以下のようになります。
| DATE | 反応したと考えられる材料 |
| 2010/01/21(A) | オバマ政権が金融規制強化を提案 |
| 2010/03/05(A’) | ギリシャ、独に財政支援要請せず |
| 2010/04/27(B) | ギリシャ国債が「投資不適格」に格下げ |
| 2010/10/08(B’) | 雇用統計が悪く、米追加金融緩和観測が高まる |
| 2010/11/30(B”) | 黄海で米韓合同軍事演習 |
昨年の傾向を観察すると、VIXが上昇するときは18ポイントをメジャーブレークして、恐怖心が一気に高まることがわかります。(A,B)一方、下がるときは、疑心暗鬼がなかなか抜けず、上下動を繰り返して18ポイント以下に戻ってきています。(A’,B’,B’’)
現在は、18ポイント前後を抵抗帯として、VIXが下落した状態にあります。
また、直近からの下落は、17ポイント前半に抵抗帯を形成しており、恐怖心の高まりは把握しやすいと考えられます。
悪い大きなニュースが発生するまでは、落ち着いた動きが想定されます。
We focus on 18pt over news and 18pt cutting news.
| DATE | reason (THE MARKET EXPECTED?) |
| 01/21/2010(A) | Obama proposes the financial regulation strengthening. |
| 03/05/2010(A’) | Greece doesn’t request the financial support to Germany. |
| 04/27/2010(B) | Greek government bond demotes to "Investing unsuitable ". |
| 10/08/2010(B’) | U.S. jobs data was bad, and the additional monetary expansion observation rises. |
| 11/30/2010(B”) | U.S. and South Korea joint military exercise begin in Yellow Sea. |
Last year’s tendencies were these; Major break occurred when the rate went upper side and fear rises at a dash. (See “A” and “B”) On the other hand, a deep-seated fear does not decrease, and the rate goes up and down around the 18 points. (See “A’”, “B’” and “B’’”)
Last rate is the lowest points. We can see the resistance around 18points.
And the recent resistance is 17 points in the first half.
I think the rate stays low side, until big bad news comes.
相場分析のリクエストがありましたら“Contact Us”からお知らせください。ご要望にお応えできるように努力いたします。
If you have some request to analyze, please write to “Contact Us”.
We do best effort for your request.


