シカゴ・オプションVIX : 芝加哥期权期货交易所波动率指数 : Chicago Options: ^VIX

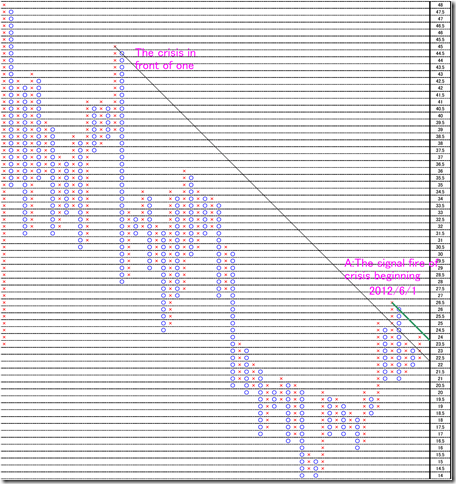
シカゴ・オプションVIX(恐怖心理指数)日足。危機手前を示唆/Chicago Options: ^VIX Daily. The market index says the crisis will come sooner in our analysis.

2012/06/14

本日はシカゴ・オプションVIX(恐怖心理指数)日足についてです。

Today, we analyze Chicago Options: ^VIX Daily data.


2012/03/27の私たちの分析では、VIXの大きな上昇時には、一定のパターンが見受けられるということを分析しました。

特徴をまとめると以下のようになります。

1. 前回高値からの45度線を超える。

2. A地点で高値を取って何事もなかったかのようにB地点まで下げる

3. A地点からの45度線を抜けて危機が始まる(C地点)

3回の危機は同じパターンでした。

In our 03/27/2012 report, we analyze there is a same pattern when the VIX index jump.

The features are following.

1. The first, the market price cuts 45 degree resistance line from the last crisis.

2. The market price takes a peak “A”, and falls to “B” point as if there was nothing occasion.

3. The market price cuts 45 degree resistance line from “A” point, and the crisis is starting.

These 3 crises occur in same pattern.


今回の相場も危機の初期段階に入っていると思います。

1回目の45度線の上抜けに成功しています。

そして、注目の緑色の45度線が出現しました。

同一パターンなら、水色の45度線を抜けるときに危機になるはずです。

We think the market went into the early stage of the crisis.

The market price has already cut 45degree resistance.

And the most important green line appeared.

If this may become the same pattern, cutting 45degree line is the entrance of the crisis.

PF


相場分析のリクエストがありましたら“Contact Us”からお知らせください。ご要望にお応えできるように努力いたします。

このブログはあくまでも個人的な見解であり、投資判断は各自でお願い致します。当ブログは一切の投資損益に対する責任を負いません。

ホームページに来て下さってありがとうございます。明日もよろしくお願いいたします。

If you have some request to analyze, please write to “Contact Us”.

We do best effort for your request.

These are only personal opinions on this blog, and you need the investment judgment in each one. This blog doesn’t assume the responsibility to all the investment profit and loss.

Thank for watching our contents. My best regards next day.


シカゴ・オプションVIX(恐怖心理指数)日足。強弱の分岐点/Chicago Options: ^VIX Daily. The turning point of the bullish or bearish.

2012/04/17

本日はシカゴ・オプションVIX(恐怖心理指数)日足についてです。

昨日の終値は19.55ポイント。

前回高値からの45度線は28ポイント近辺です。

ここを1度超え、戻ってからの再度の上方ブレークが、2008年以降の危機の特徴になっていることを前回説明しました。(2012/03/27レポート参照)

Today, we analyze Chicago Options: ^VIX Daily data.

Last day’s close data was 19.55point.

45 degree resistance line from the latest crisis is 28 point around.

We explain that this is the important line (See our 03/27/2012 report “When the big rise occurs, the price move is the always same pattern.”)


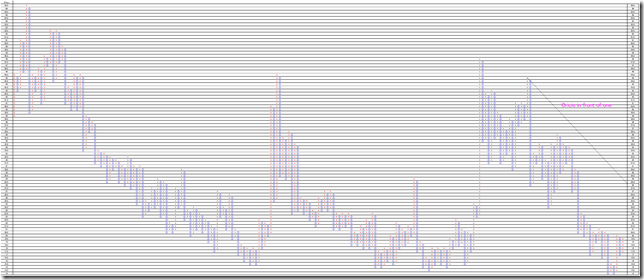
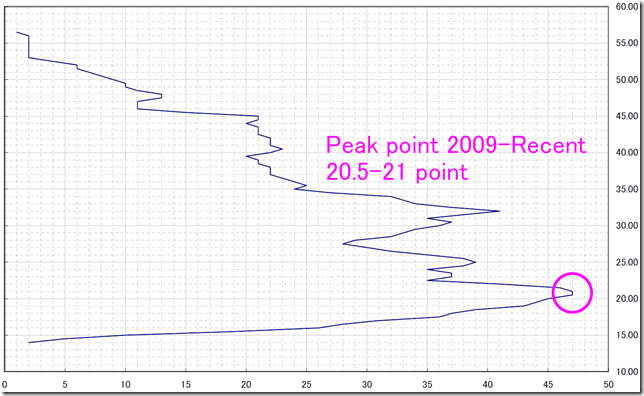
2008年から昨日までのP&Fを書き、水平方向の○×の数を勘定しました。

20.5-21.0ポイントに山のピークがあり、この付近が居心地の良い値段であると言えます。

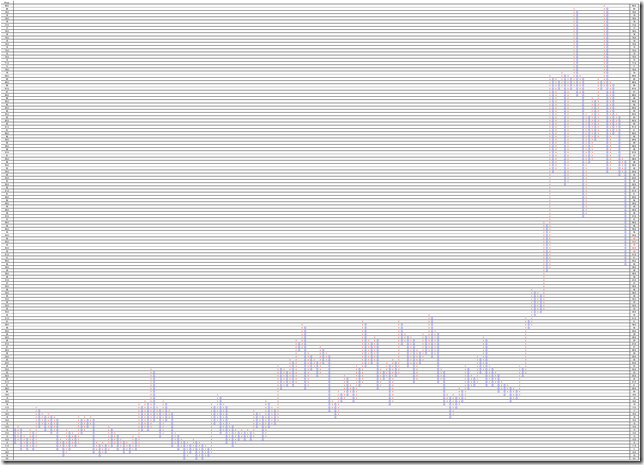
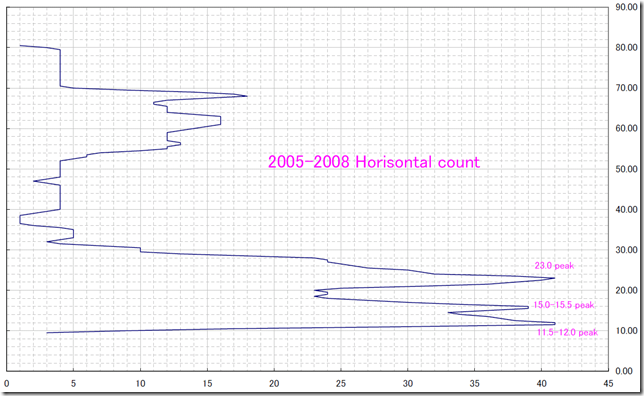
同じく2005-2008年のカウントを作成しました。

23.0ポイントの他に15.0-15.5ポイントと11.5-12.0ポイントのメジャーピークが出現しています。

株価が安定するなら、15.0-15.5ポイントと11.5-12.0ポイント付近でVIXが留まるはずだと考えられます。

しかしながら、実際の相場では、2012/03/26の14.26ポイントまでしか下落しませんでした。

15.0-15.5ポイントの滞空時間は短くVIXはなお高止まりしていると考えられます。

未だなお危機の訪れを待っているようです。

We count up the P&F horizontal “circle” and “x-mark” from 2008 to yesterday.

There is a peak 20.5 – 21.0 point around; this point around is the comfortable market price.

And we made the same chart from 2005-2008.

There is a peak at 23.0point and we can see 15.0-15.5point and 11.5-12.0point peak.

If market does not fear the crisis, the market price will stay 15.0-15.5 point or 11.5-12.0 point around.

But the recent market only drops 14.26point in 03/26/2012.

The stay of 15.0-15.5point around was very short time, and we think the market price is still stay in high level.

We think the market is still waiting for the crisis.

2009_recent_PF

2009_rencet_count

2005_2008_PF

2005_2008_count


相場分析のリクエストがありましたら“Contact Us”からお知らせください。ご要望にお応えできるように努力いたします。

このブログはあくまでも個人的な見解であり、投資判断は各自でお願い致します。当ブログは一切の投資損益に対する責任を負いません。

ホームページに来て下さってありがとうございます。明日もよろしくお願いいたします。

If you have some request to analyze, please write to “Contact Us”.

We do best effort for your request.

These are only personal opinions on this blog, and you need the investment judgment in each one. This blog doesn’t assume the responsibility to all the investment profit and loss.

Thank for watching our contents. My best regards next day.

© 2025 Retar