シカゴ・オプションVIX : 芝加哥期权期货交易所波动率指数 : Chicago Options: ^VIX

シカゴ・オプションVIX(恐怖心理指数)日足。上昇時は、いつも同じパターン/Chicago Options: ^VIX Daily. When the big rise occurs, the price move is the always same pattern.

2012/03/27

本日はシカゴ・オプションVIX(恐怖心理指数)日足についてです。

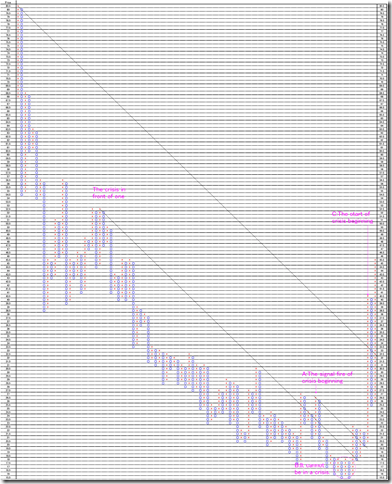
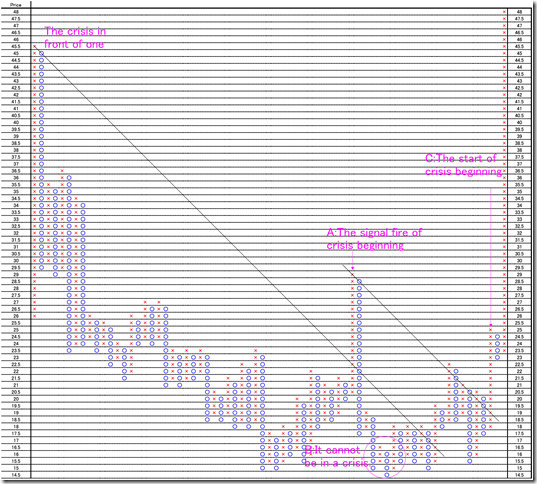
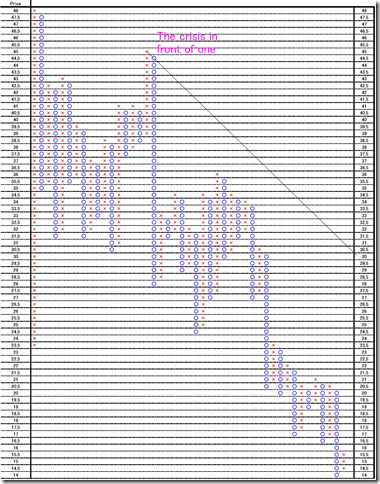
大きな上昇時の特徴をポイントアンドフィギュアで調査しました。

Today, we analyze Chicago Options: ^VIX Daily data.

We analyze unique character of big rise by Point and figure chart.

リーマンショック前(2008年)/Before Lehman Shock (2008)

01

ギリシャショック前(2010年)/Before Greek financial crisis(2010)

02


米国債格下げ前(2011年)/Before U.S. Treasury bond degradation (2011)

03


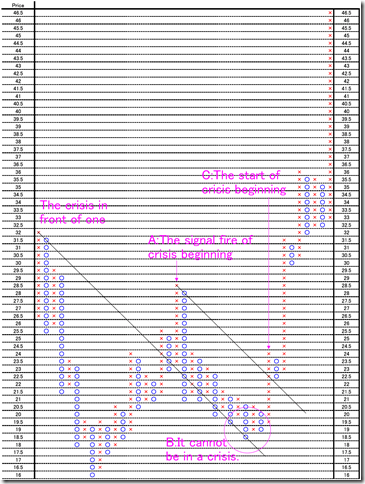
特徴をまとめると以下のようになります。

1. 前回高値からの45度線を超える。

2. A地点で高値を取って何事もなかったかのようにB地点まで下げる

3. A地点からの45度線を抜けて危機が始まる(C地点)

3回の危機は同じパターンでした。

The features are following.

1. The first, the market price cuts 45 degree resistance line from the last crisis.

2. The market price takes a peak “A”, and falls to “B” point as if there was nothing occasion.

3. The market price cuts 45 degree resistance line from “A” point, and the crisis is starting.

These 3 crises occur in same pattern.


最近の相場/The recent market

04


最近の相場では、米国債格下げ高値からの45度線を一度抜けておりません。

同じパターンで起こることを想定するなら、危機はA点を形成してから意識しても遅くはないと思います。

The recent market does not cut the 45 degree resistance from U.S. Treasury bond degradation.

If the market crisis may occurs as same pattern, it is not too late noticing until the market price forms “A” point.


相場分析のリクエストがありましたら“Contact Us”からお知らせください。ご要望にお応えできるように努力いたします。

このブログはあくまでも個人的な見解であり、投資判断は各自でお願い致します。当ブログは一切の投資損益に対する責任を負いません。

ホームページに来て下さってありがとうございます。明日もよろしくお願いいたします。

If you have some request to analyze, please write to “Contact Us”.

We do best effort for your request.

These are only personal opinions on this blog, and you need the investment judgment in each one. This blog doesn’t assume the responsibility to all the investment profit and loss.

Thank for watching our contents. My best regards next day.


シカゴ・オプションVIX(恐怖心理指数)日柄。次の危機は2012/10か2013/03では?/Chicago Options: ^VIX Daily. The next crisis may come in 2012/10 or 2013/03.

2012/03/19

本日はシカゴ・オプションVIX(恐怖心理指数)日足についてです。

Today, we analyze Chicago Options: ^VIX Daily data.


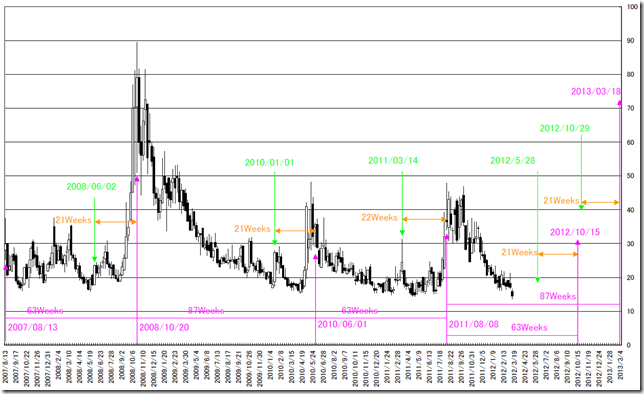
今回はVIXの日柄の特徴について調査しました。

2つのことがわかりましたので、紹介いたします。

Today, we analyze unique characteristics of VIX “HIGARA”.

We found two unique characteristics.

VIX


1.63週、87週は要注意/63weeks and 87weeks need special attention.

最近のVIXは約63週または約87週の周期で、高値を取りにきています。(63 * 1.382 = 87)

今度、同じ周期で高値をとりにくると、63週の周期でとりにくるなら2012/10/15の週、87週の周期でとりにくるなら2013/04/01の週(87週)から2013/03/15の週(85週)となります。

はっきりした頂点というよりも、2012/10頃、2013/03頃の意識で良いと思います。

The recent VIX peaks come about 63 or 87 weeks cycles. (63 * 1.382 = 87)

If the next peak comes as same cycle as the last time, in 63 weeks case, the peak point is 10/15/2012 week and in 87 weeks case, the peak point is from 2013/04/01week (87weeks) to 2013/03/15 week (85weeks).

These are only the rough peaks, so we need to pay attention to 2012/10 and 2013/03.

2.危機の約21週前は一旦上昇し、低下する/ About 21 weeks before a crisis coming, the market price once jump.

危機が発生する約21週前には、大陽線や上ヒゲを残して、今後の危機を示唆するような動きをしています。

63週の周期で危機を迎えるのであれば、2012/05/28の週近辺に注意が必要です。

85週の周期で危機を迎えるのであれば、2012/10/29の週近辺に注意が必要です。

About 21 weeks before a crisis coming, the market price forms big white candle stick or long upper shadow; this may suggest crisis.

If the market crisis comes in 63 weeks cycle, we need to pay attention to 2012/05/28 week around.

If the market crisis comes in 85 weeks cycle, we need to pay attention to 2012/10/29 week around.


相場分析のリクエストがありましたら“Contact Us”からお知らせください。ご要望にお応えできるように努力いたします。

このブログはあくまでも個人的な見解であり、投資判断は各自でお願い致します。当ブログは一切の投資損益に対する責任を負いません。

ホームページに来て下さってありがとうございます。明日もよろしくお願いいたします。

If you have some request to analyze, please write to “Contact Us”.

We do best effort for your request.

These are only personal opinions on this blog, and you need the investment judgment in each one. This blog doesn’t assume the responsibility to all the investment profit and loss.

Thank for watching our contents. My best regards next day.

© 2025 Retar