NY GOLD月足・2012年11月、12月も強い変化日(月)、1631.6ポイントは分水嶺
NY GOLD; 11/2012 and 12/2012 will become “HENKABI” month and 1631.6 point will work as watershed.
纽约黄金。2012年11月和12月强的"变化月" 1631.6点分水岭。
本日はNYGOLD月足についてです。
一目均衡表の難しさは何かと問われたら、一番難しいのは相場が9,17,26,33,42,51(52),65,76で完璧に縛られていることを理解する(信じる)ことだと思います。
1930年代に世界の真理とも言える数値を見つけ出し、完全な投資システムに昇華させた一目山人氏に改めて敬意を表します。
Today’s analyze is NY GOLD monthly.
What is the most difficulty to understand “ICHIMOKU” method?
We think you must believe the market is perfectly tied up with 9, 17, 26, 33, 42, 51(52), 65, 76 numbers.
Mr. ICHIMOKU SANJIN produced brilliant achievements in 1930’s and we respect him.
結論を申し上げると、先月から今月にかけて、本物らしいトレンドの出やすいところといえます。
これを説明するために、この相場の基点はいつであったのかを考える必要があります。
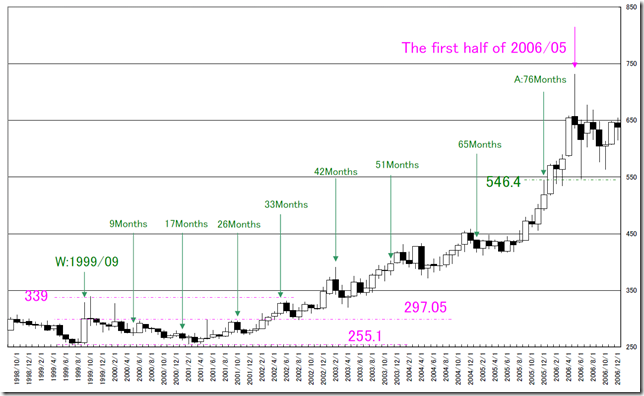
はじめにW(1999/09)から始まる緑系列に注目します。
ポイントはA地点(76月)の高値(546.4ポイント)がサポートとなり、上昇相場に転じているところです。1巡(76月)した月の高値が下値サポートとして利いていました。
In our conclusion, the real market trend will come in this month or last month.
Explaining this result, we need to find out the real market trend starting point.
First, we see Green series (W) from 09/1999.
The point was “A” (76months:1JUN) high price (546.4point); this price worked as support point.
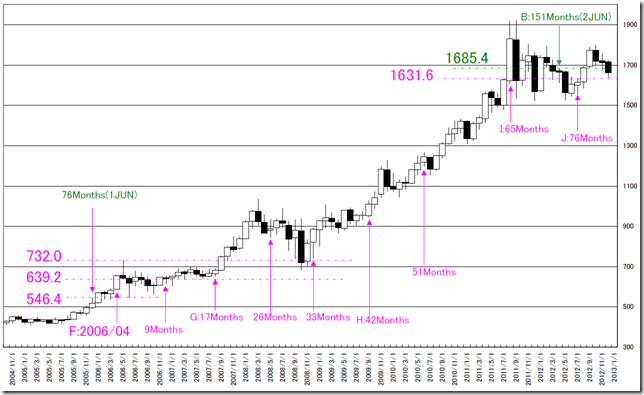
もう一点の重要な相場は、リーマンショック時の持ち合い開始F(2006/04)から始まるピンク系列です。
この相場も76月を終え、高値は1631.6ポイントになりました。
今のところ、この相場だけは、このまま相場が反転に向かえば、チャートの型としては納得の型になります。
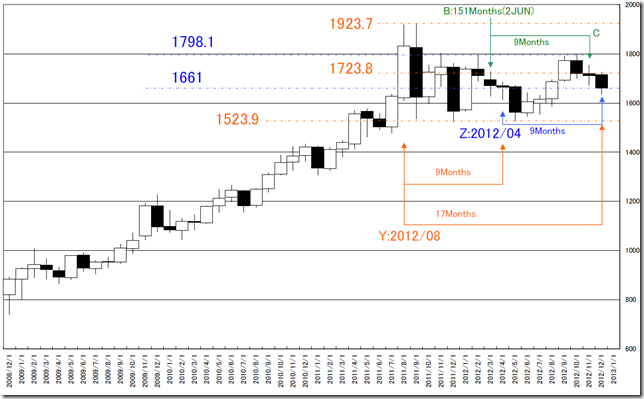
ところが、B地点(2巡の151月、緑系列)では、高値である1685.4ポイントを下抜けてきています。
And other important series is Pink series (F) from 04/2006.
This market ended 76 months and at that time’s highest was 1631.6 point.
Now, this market is the only reason to reverse the market trend; if the market trend may become bullish, we can convince the chart formation.
But, at “B” point (151months, 2JUN, Green series), the market price cut the highest 1685.4 point.
更に最近の相場です。
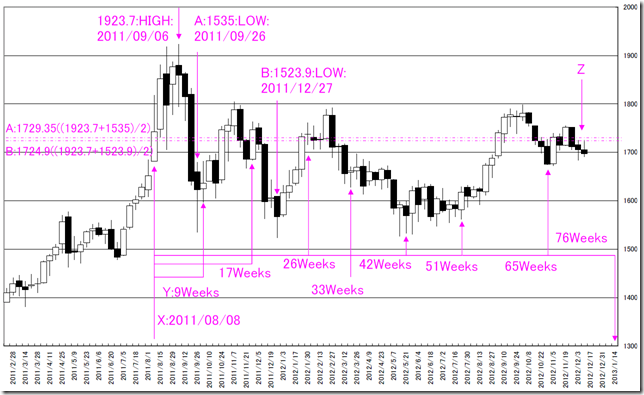
B地点(2012/03)から3巡目がスタートしたとすると、2012/11は9月経っており、変化日(月)となってもおかしくありません。
また、Y(2011/08)から始まるオレンジ系列では、2012/12は17月目となるため、変化日(月)である可能性があります。
これはZ(2012/04)から始まる青系列でも、2012/12は9月目となるため、変化日(月)である可能性があります。
And this is the recent market.
If the market start “3 JUN” (3 times cycle) from 03/2012 (B point), it takes 9 months (11/2012) and this month may become “HENKABI” month.
And starting from “Y” point (Orange series, 08/2011), it takes 17 months (12/2012) and this month may become “HENKABI” month.
Moreover, starting from “Z” point (Orange series, 04/2012), it takes 9 months (12/2012) and this month may become “HENKABI” month.
値段についてまとめてみます。
先週末の終値は、1660.1ポイント。
本日紹介した重要価格の中で、ここより下方向にある月足線のサポート価格は、1523.9ポイントと1631.6ポイントのみ。
まずは、1631.6ポイントを死守できるか注目です。
We summarize a price.
Last week close price was 1660.1 point.
We introduced some important prices and 1523.9 and 1631.6 point are the important prices under now.
Now, we need to watch the market price will cut 1631.6 point or not.
相場分析のリクエストがありましたら“Contact Us”からお知らせください。ご要望にお応えできるように努力いたします。
このブログはあくまでも個人的な見解であり、投資判断は各自でお願い致します。当ブログは一切の投資損益に対する責任を負いません。
ホームページに来て下さってありがとうございます。明日もよろしくお願いいたします。
If you have some request to analyze, please write to “Contact Us”.
We do best effort for your request.
These are only personal opinions on this blog, and you need the investment judgment in each one. This blog doesn’t assume the responsibility to all the investment profit and loss.
Thank for watching our contents. My best regards next day.


