NY銀 : 纽约白银 : NY SILVER

ニューヨーク銀にトレンドの兆し/There are some possibilities NY silver market may become a trend./有一些可能性纽约白银市场可能会成为一种趋势。

2012/07/25

ニューヨーク銀にトレンドの兆し。ヒゲ抜けに注目。

There are some possibilities NY silver market may become a trend. See lower shadow cutting.

有一些可能性纽约白银市场可能会成为一种趋势。看到下影线切割。


本日はNY銀日足です。

Today, we analyze NY Silver.


2012/06/25のレポートで「ニューヨーク銀日足。底割れ警戒。ターゲット23.50ポイント、17.00ポイント」としておりましたが、見方を変えておりません。

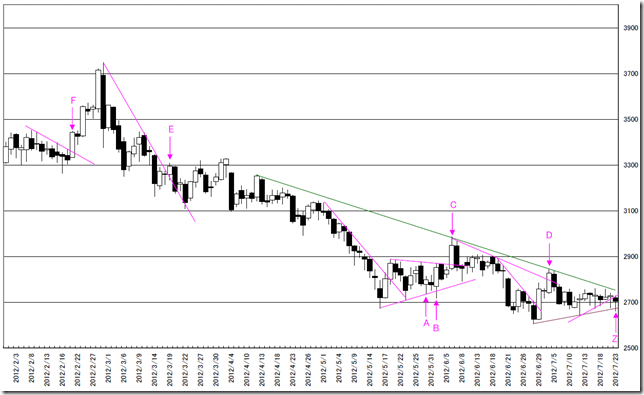
2012/07/23に注目していたトレンドラインを抜けてきました。(Z点)

トレンド発生のシグナルかもしれません。

B点のようにだましとなることもありますが、だましとなることはあってもトレンドの発生は小さな変化から始まります。

最近のだましは1営業日で帰ってくる(C点、D点、E点)パターンが多いようにみえます。

2-3営業日の間戻さないようなら、本物のトレンドの可能性があります。

In 06/25/2012, we reported “NY silver daily market. Caution of the bottom breaking is necessary and the target price is 23.50point or 17.00point” and our view is not change.

The market price cut the trend line at “Z” point.

This may imply the trend occurrence signal.

This may become fake point such as “B” point but we need to watch the chart whispering.

We can see “One day reversal pattern” in recent market. (C point D point, E point)

If the market price can not recover 2 or 3 days, this may be the true trend occurrence.

CHART


相場分析のリクエストがありましたら“Contact Us”からお知らせください。ご要望にお応えできるように努力いたします。

このブログはあくまでも個人的な見解であり、投資判断は各自でお願い致します。当ブログは一切の投資損益に対する責任を負いません。

ホームページに来て下さってありがとうございます。明日もよろしくお願いいたします。

If you have some request to analyze, please write to “Contact Us”.

We do best effort for your request.

These are only personal opinions on this blog, and you need the investment judgment in each one. This blog doesn’t assume the responsibility to all the investment profit and loss.

Thank for watching our contents. My best regards next day.


ニューヨーク銀日足。パート3:1971-1974年相場をなぞるなら、どこかの時点で力強い上昇/ NY silver daily market. If the market price will follows from 1971 to 1974 market, the market price will jump up. Part 3.

2012/07/10

本日はNY銀を分析します。

Today we analyze NY silver.


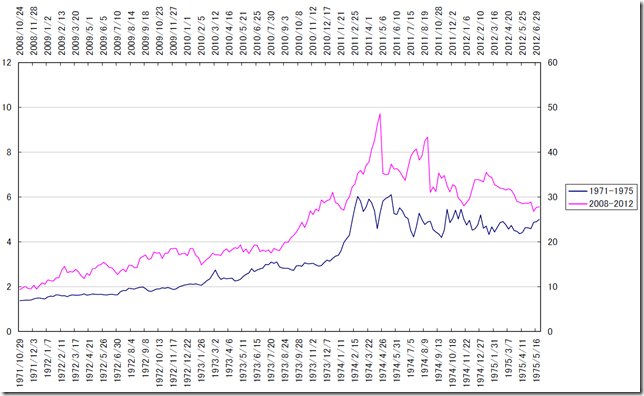
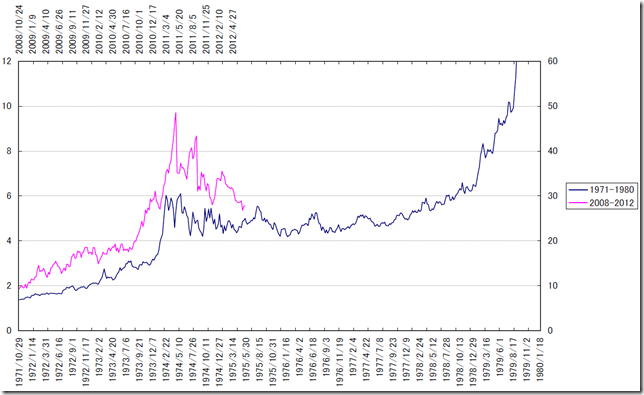
1971/10/29の週から1980/01/18の週までの銀の動きと2008/10/31の週から現在までの銀相場の動きを重ね合わせてみました。

日柄的にもほぼ同じ日数で上昇しています。

1971年のパターンでは、底値を切り上げたまま下落することなく1980年高値をとりました。

現在のパターンでも27ドル近辺では底堅く推移しておりよく似ています。

同じ日柄で天井を取るなら、2017/3/3の週に天井をとりにくることになります。

This is the chart of silver weekly data from 10/29/1971 to 01/18/1980 and from 10/31/2008 to last week.

We think “HIGARA” is very similar.

In 1971 pattern, the market price did not fall to the bottom around and took the highest in 1980.

In recent pattern, the market price did not cut 27point; this is very similar.

If the market price will take the highest as the same “HIGARA”, it will be 03/03/2017 week.

02

01


相場分析のリクエストがありましたら“Contact Us”からお知らせください。ご要望にお応えできるように努力いたします。

このブログはあくまでも個人的な見解であり、投資判断は各自でお願い致します。当ブログは一切の投資損益に対する責任を負いません。

ホームページに来て下さってありがとうございます。明日もよろしくお願いいたします。

If you have some request to analyze, please write to “Contact Us”.

We do best effort for your request.

These are only personal opinions on this blog, and you need the investment judgment in each one. This blog doesn’t assume the responsibility to all the investment profit and loss.

Thank for watching our contents. My best regards next day.

© 2025 Retar