TOPIX : 东证综合指数

TOPIX日足・一旦の押しの後、860-870ポイントまで一気に戻ることも想定/TOPIX daily. We need to notice the market price may reach 860-870 point.

2012/02/15

本日はTOPIX日足についてです。

Today’s analyze is TOPIX (Tokyo stock Price Index) daily.


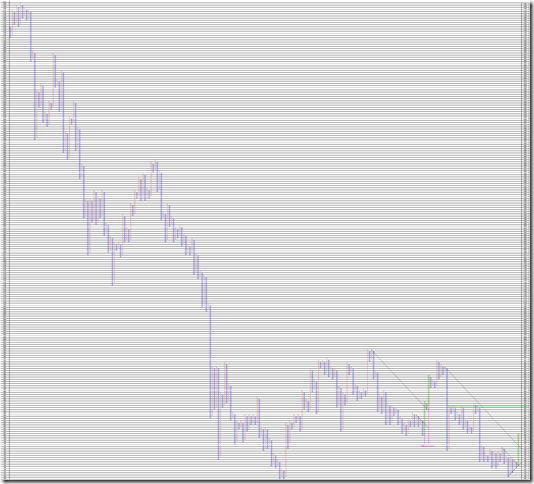
1枠5point、3枠転換の終値ポイントアンドフィギュアです。

今回は三角持ち合いからの上方ブレークのチャートとなりました。

今後を想定すると、2010/11/02からの上げは15枠移動だったので、一旦押した後、再び同じだけ上昇を続けるパターンも考えられます。

This is 5point change and 3 box reversal close price’s Point and Figure chart.

In this time, the price forms pennant and goes upper side.

The price moves 15 boxes and the move at 11/02/2010 is also 15 boxes move; we think the market price may form a dip at once and rise again.

PF


相場分析のリクエストがありましたら“Contact Us”からお知らせください。ご要望にお応えできるように努力いたします。

このブログはあくまでも個人的な見解であり、投資判断は各自でお願い致します。当ブログは一切の投資損益に対する責任を負いません。

ホームページに来て下さってありがとうございます。明日もよろしくお願いいたします。

If you have some request to analyze, please write to “Contact Us”.

We do best effort for your request.

These are only personal opinions on this blog, and you need the investment judgment in each one. This blog doesn’t assume the responsibility to all the investment profit and loss.

Thank for watching our contents. My best regards next day.


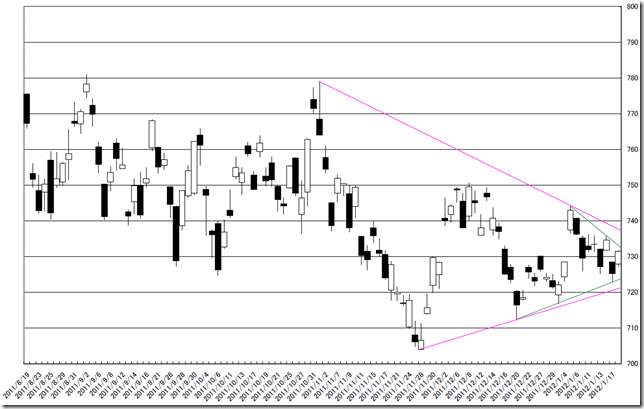
TOPIX日足。4手切り下げ型の行き違い線/TOPIX daily. The market price formed reducing high price in 4 candle sticks and crossing price candle stick formation.

2012/01/17

TOPIX日足が見たことがない足を出したので、ご紹介いたします。

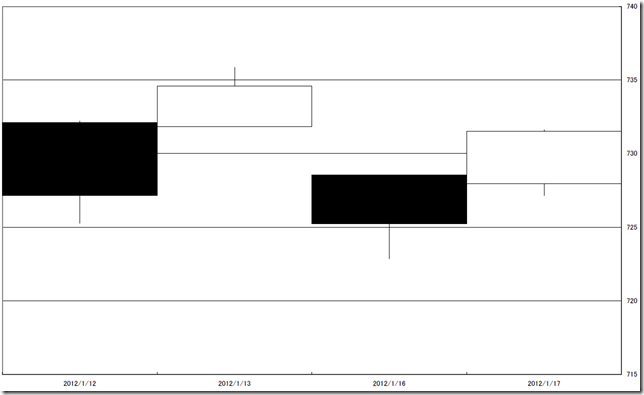
今日まで4手で2回の「切り下げ型の行き違い線」を出しています。

同じような4手をRetar.jpのろうそく足検索テクノロジー™を使用し探し出してみました。

ダウ工業株(1938年-現在)、日経225(1991年-現在)、TOPIX(1991年-現在)で使い探してみましたが、初めての足でした。

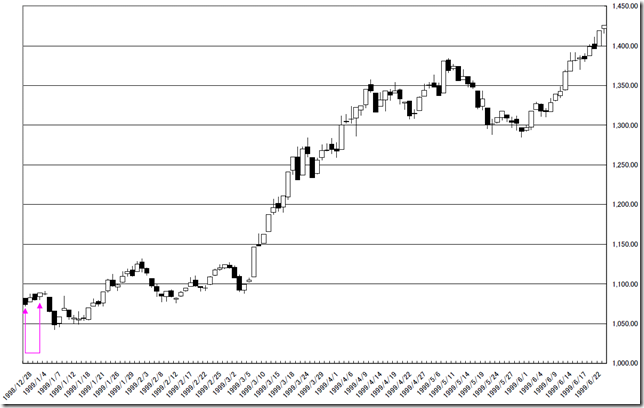
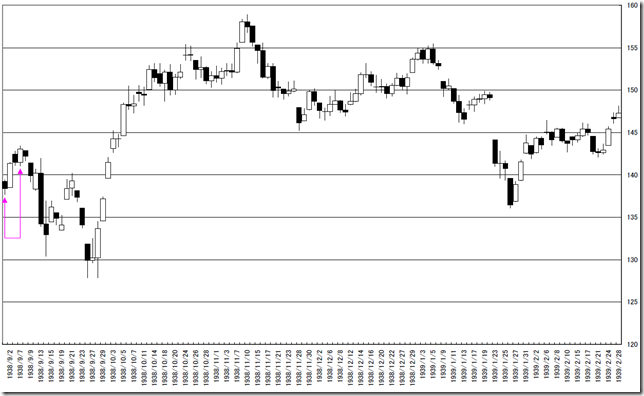
似たような足として切り上げ型のろうそく足を、1938年のダウ株と、1998年のTOPIXで発見することができました。

Today, we introduce very unique TOPIX daily chart.

The market price formed the down side crossing price candle stick formation twice in recent 4 days.

We used our “Candle Stick Seeking Technology”™.

This is the first time this formation appeared in DJI (from 1928 to recent), NIKKEI225 (from 1991 to recent) and TOPIX (form 1991 to recent).

We can only find the up side crossing price candle stick formation in DJI 1938 and TOPIX 1998.

00

01


前例がなく、判断が難しいのですが、わかりやすく2回、酒田五法の「下げ相場の中の行き違い線」が出ていると捉えるべきではないかと考えます。

This is unprecedented case, and difficult to judge.

To stretch a point, we think the crossing price candle stick formation in bearish market appeared twice and it predicts the market future.

02

03


相場分析のリクエストがありましたら“Contact Us”からお知らせください。ご要望にお応えできるように努力いたします。

このブログはあくまでも個人的な見解であり、投資判断は各自でお願い致します。当ブログは一切の投資損益に対する責任を負いません。

ホームページに来て下さってありがとうございます。明日もよろしくお願いいたします。

If you have some request to analyze, please write to “Contact Us”.

We do best effort for your request.

These are only personal opinions on this blog, and you need the investment judgment in each one. This blog doesn’t assume the responsibility to all the investment profit and loss.

Thank for watching our contents. My best regards next day.

© 2025 Retar