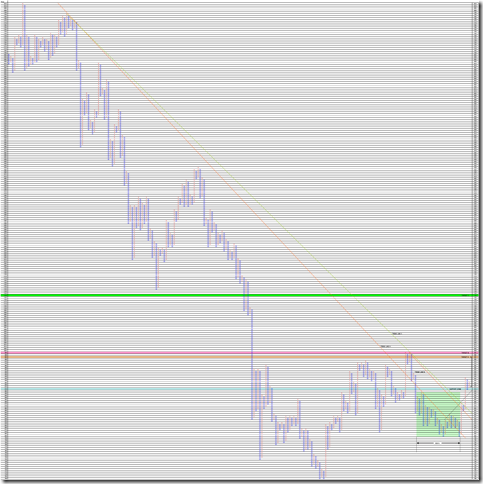
TOPIX : 东证综合指数

TOPIX日足・ガス欠近し?/TOPIX (Tokyo stock Price Index) Daily. Bullish trend may be end sooner?

2011/02/18

本日はTOPIX日足についてです。

Today’s analyze is TOPIX (Tokyo stock Price Index) daily.


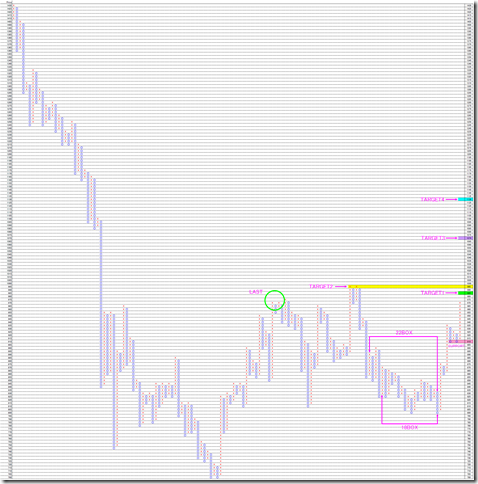
1枠5point、3枠転換の終値ポイントアンドフィギュアです。

昨日のデータで作成しています。

想定される目標値です。

Target1

985point

垂直ムーブのターゲット

Target2

995point

2010年高値

Target3

1070point

18枠持ち合いからの水平分析ターゲット

Target4

1130point

22枠持ち合いからの水平分析ターゲット

Support

910 point

2回底打ち

3枠転換するまでは上昇基調とみますが、ここから先は、目標に届かなくても何度も撃ち落された価格帯です。

スルスルと抜けるのか、もみ合うのか注目が必要です。

This is 5point change and 3 box reversal close price’s Point and Figure chart.

We made it by last day’s data.

Under these are estimated target values.

Target1

985point

Vertical method target

Target2

995point

Last year highest

Target3

1070point

18box horizontal method target

Target4

1130point

22box horizontal method target

Support

910 point

Double dip

I think bullish trend is still going on until 3 boxes reversal.

But in the past, these price ranges worked reversal points.

We need to notice trend will going on or not.

PF

相場分析のリクエストがありましたら“Contact Us”からお知らせください。ご要望にお応えできるように努力いたします。

このブログはあくまでも個人的な見解であり、投資判断は各自でお願い致します。当ブログは一切の投資損益に対する責任を負いません。

ホームページに来て下さってありがとうございます。明日もよろしくお願いいたします。

If you have some request to analyze, please write to “Contact Us”.

We do best effort for your request.

These are only personal opinions on this blog, and you need the investment judgment in each one. This blog doesn’t assume the responsibility to all the investment profit and loss.

Thank for watching our contents. My best regards next day.


TOPIX日足・上昇に期待/TOPIX (Tokyo stock Price Index) Daily. Bull trend is still going on.

2011/01/28

本日はTOPIX日足についてです。

Today’s analyze is TOPIX (Tokyo stock Price Index) daily.


topix


1枠5point、3枠転換の終値ポイントアンドフィギュアです。

2007/1/4から2011/1/28までのデータで作成しています。

TREND LINE A

2007年からの45度レジスタンス

TREND LINE B

2010年高値からの45度レジスタンス

TREND LINE C

2010年高値、2007年のレジスタンス

TARGET A

前回、前々回のメジャームーブ15ボックスの到達点

TARGET B

2010年高値のダブルトップ

TARGET C

持ち合いからの水平分析のターゲット


This is 5point change and 3 box reversal close price’s Point and Figure chart.

We make it by from 1/4/2007 to 1/28/2011’s rate.

TREND LINE A

Trend line drawing from 2007.

TREND LINE B

Trend line drawing from 2010’s highest.

TREND LINE C

Trend line drawing from 2007 to 2010’s highest.

TARGET A

Majored move reaching 15 box.

TARGET B

2010’s double top price.

TARGET C

Caluclating from the horizontal method.

TOPIXは力強い上昇がみられます。

2010年には「TREND LINE A」をブレークし、上昇期待は高まりましたが、ダブルトップを形成し、下落に転じました。今回の上昇は「TREND LINE A」、「TREND LINE B」、「TREND LINE C」をブレークしており、上伸が期待できます。

では、どこまで上伸が期待できるのでしょうか?

はじめのターゲットは、1000ポイント前後に控える「TARGET A」、「TARGET B」だと考えられます。

特に「TARGET B」は、注目のブレークポイントだと思います。

「TARGET C」は、上伸したときの最終目標的な場所です。値固めに失敗し下落することもあると思います。

We can see the strong bull trend in TOPIX price.

In 2010, the price cut the “TREND LINE A”, but the price make double top and cut the trend line again.

In this time, the rate cut “TREND LINE A”, “TREND LINE B” and “TREND LINE C”; We expect “Bull trend may come”.

Where is the target?

I think first target is 1000 point aroud such as “Target A” or “Target B”.

Especially, we need to watch cutting “Target B”.

“Target C” is the final target. And this target may fail to reach.


相場分析のリクエストがありましたら“Contact Us”からお知らせください。ご要望にお応えできるように努力いたします。

If you have some request to analyze, please write to “Contact Us”.

We do best effort for your request.

ホームページに来て下さってありがとうございます。明日もよろしくお願いいたします。

Thank for watching our contents. My best regards next day.
このブログはあくまでも個人的な見解であり、投資判断は各自でお願い致します。当ブログは一切の投資損益に対する責任を負いません。

These are only personal opinions on this blog, and you need the investment judgment in each one. This blog doesn’t assume the responsibility to all the investment profit and loss.


© 2025 Retar