2011/03

上海総合指数日足・上昇基調/SSE Composite Index (Shanghai: 000001.SS) Daily. Bullish trend.

2011/03/09

本日は上海総合指数日足についてです。

Today’s analyze is SSE Composite Index daily data.


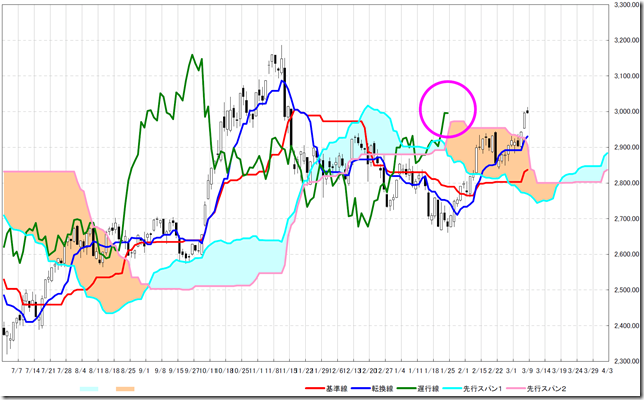
一目均衡表では再び遅行スパンが雲抜けしてきています。

株価も雲抜けしており、上昇の強い地合いです。

この先の雲のねじれに注意です。

The late span goes over the cloud again at “ICHIMOKU” chart.

And the price also goes over the cloud, we can see bullish trend.

We need to taking care of “twisting cloud”.

ichi

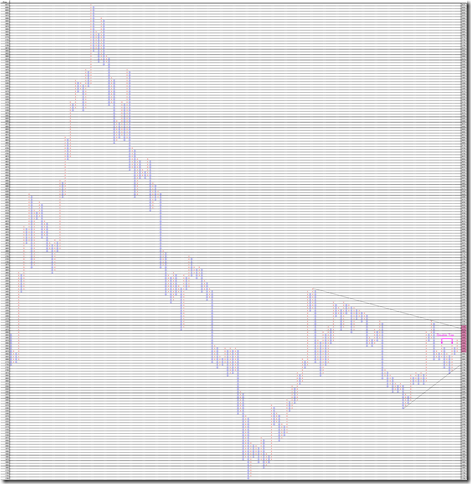
1枠25ポイント、3枠転換の終値ポイントアンドフィギュアです。

値固めを想定していましたが、しっかりとした上昇に転じています。

ターゲットは垂直分析で最外郭のレジスタンスとも一致する3100ポイント。

このレベルをぬけてくるとしっかりとした上昇相場が確認できると思います。

This is 25 point change and 3 box reversal close price’s Point and Figure chart.

We expected range market, but we can see upper side trend.

The target price is 3100point calculated by vertical method, and this is as same as most outer resistance line.

If the price cuts this level, we can see strong bullish trend.

pf


相場分析のリクエストがありましたら“Contact Us”からお知らせください。ご要望にお応えできるように努力いたします。

このブログはあくまでも個人的な見解であり、投資判断は各自でお願い致します。当ブログは一切の投資損益に対する責任を負いません。

ホームページに来て下さってありがとうございます。明日もよろしくお願いいたします。

If you have some request to analyze, please write to “Contact Us”.

We do best effort for your request.

These are only personal opinions on this blog, and you need the investment judgment in each one. This blog doesn’t assume the responsibility to all the investment profit and loss.

Thank for watching our contents. My best regards next day.


スキュー指数・最新インデックスのP&F/Skew Index. This is P&F of the latest index.

2011/03/08

本日はSKEW INDEX(スキュー・インデックス)のポイントアンドフィギュアを書いてみました。

SKEW INDEX(スキュー・インデックス)は、S&P500指数のオプション市場で極端な事象が発生するリスクを示す指標です。

“Tail Risk(テイル・リスク)”とか “Black Swan Event(ブラック・スワン・イベント)”といわれるものです。

ポイントアンドフィギュアがSKEW INDEXの分析に適しているか、どうかはわかりませんが、今後検証をすすめてまいりたいと思います

1ポイント、0.5ポイントのチャートが有効に機能しそうです。

Today we write the CBOE S&P 500 Skew Index of Point and Figure.

The CBOE S&P 500 Skew Index is a benchmark measure of the perceived risk of extreme negative moves — often referred to as "tail risk" or a "black swan" event — in U.S. equity markets.

We do not know Point and Figure is most fitting analyzing way. So we will need to analyze some way.

We think 1point and 0.5 point chart may work well.

1point chart

1


0.5point chart

05


相場分析のリクエストがありましたら“Contact Us”からお知らせください。ご要望にお応えできるように努力いたします。

このブログはあくまでも個人的な見解であり、投資判断は各自でお願い致します。当ブログは一切の投資損益に対する責任を負いません。

ホームページに来て下さってありがとうございます。明日もよろしくお願いいたします。

If you have some request to analyze, please write to “Contact Us”.

We do best effort for your request.

These are only personal opinions on this blog, and you need the investment judgment in each one. This blog doesn’t assume the responsibility to all the investment profit and loss.

Thank for watching our contents. My best regards next day.

© 2025 Retar