2012/07

ニューヨーク銀日足。1971-1974年相場をなぞっているのでは?/ NY silver daily market. We think the recent market follows from 1971 to 1974 market.

2012/07/05

本日はNY銀を分析します。

テクニカル分析の基本は過去を研究し現在、未来を考えることです。

言い換えるならば歴史は繰り返すものです。

振り返るべき相場は無限にあり、値動きの研究に終わりはありません。

今回から数回、1970年代初頭のデータと現在の相場の類似性について説明したいと思います。

Today we analyze NY silver.

The basic of technical analyzing is “Review the past and know the present and future.”

In other words, history repeats itself.

There are infinity markets and we can not reach the end of the research.

We explain the similarly of the market price movement between the beginning of 1970’s market and the recent market.


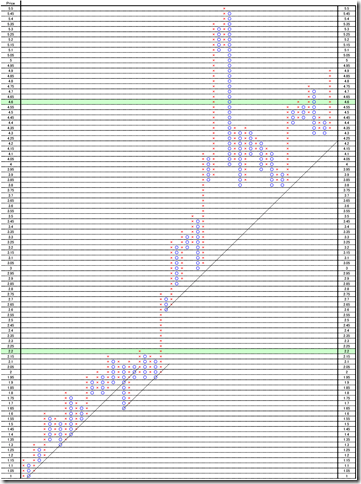
1971年から1974年のP&Fです。

私の入手したNY銀のデータによる1971/11/1が終値の最安値1.362ポイント、1974/2/27の終値は6.22ポイントとなっておりました。

1971/11/1のデータを1倍として、その何倍になったかをチャートにしました。

そして最高値は安値からの4.6倍になりました。

この間570営業日です。

This is P&F from 1971 to 1974.

According out Silver data, the lowest price is 1.362 point in 01/11/1971 and the peak point is 6.23 point in 05/15/1974.

We made the data as 1.00 point as 11/01/1971 close price and how much times did it become.

The highest price is 4.6 times from the lowest.

And it takes 623 business days.

1971


次に最近の相場です。

最安値は2008/10/28の8.79ポイント、最高値は2011/04/29の48.584ポイントです。

2008/10/28のデータを1として、その何倍になったかをチャートにしました。

そして最高値は安値からの5.53倍になりました。

戻り高値は2011/8/22は43.325ポイントで4.9倍でした。

この間631営業日です。

Next is the recent market.

The lowest price was 8.79point in 10/28/2008 and the highest point is 48.584point in 04/29/2011.

It became 5.53 times from the lowest.

The recovery high was 43.325point in 08/22/2011 and it was 4.9 times.

And it takes 631 business days.

2011


1971年パターンでは2.3倍近辺で値段なれたこと、2010年パターンでは2.2倍で強いブレークアウトをしたところは良く似ています。

2010年パターンでは戻り高値4.6倍付近でもみ合いになっていることも、大変に類似している点だと考えております。

It is similar that the upside breaking point was 2.3point in 1971 and 2.2 point in 2010.

And in 2010 case, the market price made the steadiness at 4.6 point around.

These facts are very similar.


今後はハント兄弟買占めまで徹底的に分析していきますのでお楽しみに。

We will analyze thoroughly to a hunt brother buyout from now on.

Don’t miss it.


相場分析のリクエストがありましたら“Contact Us”からお知らせください。ご要望にお応えできるように努力いたします。

このブログはあくまでも個人的な見解であり、投資判断は各自でお願い致します。当ブログは一切の投資損益に対する責任を負いません。

ホームページに来て下さってありがとうございます。明日もよろしくお願いいたします。

If you have some request to analyze, please write to “Contact Us”.

We do best effort for your request.

These are only personal opinions on this blog, and you need the investment judgment in each one. This blog doesn’t assume the responsibility to all the investment profit and loss.

Thank for watching our contents. My best regards next day.


ドル円中長期。下落ターゲット74.50円/ Dollar/Yen mid and long term. The falling target price is 74.50yen.

2012/07/04

本日はドル円についてです。

「ドル円長期足。後味は悪くとも下落相場に転換と見ています」の通りです。(2012/06/06レポート参照)

未だ後味の悪い上昇です。

週末NYクローズに82.00円以上をつけるまでは、下落トレンド継続だと私は思います。

Today’s analyze is Dollar/Yen rate.

We reported “Long term USDJPY view. As aftertaste is bad; we think the market became bearish market.” in 06/06/2012 report.

The recent rally market remains bad aftertaste.

We think now is bear market until the weekend NY close price will go over 82.00yen.


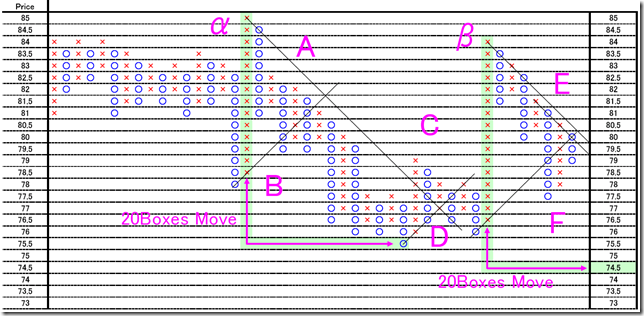
1枠0.5円、3枠転換の終値ポイントアンドフィギュアです。

1時間足を使用しオセアニア時間帯を省いています。

2010年11月からのデータで作成しています。

ドル円はポイントアンドフィギュアの45度線の特徴が良く現れた相場だと感じております。

テクニカル分析の基本は過去を研究し現在、未来を考えることです。

This is 0.5 price change and 3 box reversal close price’s Point and Figure chart.

We used hourly data and the Oceania time zone market price is pulled out.

We made it from 11/2010 data.

This chart stands out P&F 45degree resistances and supports unique character.

The basic of technical analyzing is “Review the past and know the present and future.”

PF


A点とB点/ “A” point and “B” point

B方向に最初に45度線の割り込みが発生しました。

その後75円台に突っ込みました。

The market price cut 45 degree support first and went to “B” direction.

After that, the market price went to 75yen.


C点とD点/ “C” point and “D” point

高値と安値のうちC方向に最初に45度線の割り込みが発生しました。

84円まで戻しました。

The market price cut 45 degree resistance first and went to “C” direction.

After that, the market price went to 84yen.


E点とF点/ “E” point and “F” point

高値と安値のうちF方向に最初に45度線の割り込みが発生しました。

現在の相場です。

きっと、こうなるなぁ?と思うはずです。

The market price cut 45 degree support first and went to “F” direction.

This is the recent market.

And you can find out what would become.


下げ方向に向かうとするならば、αからの下げ幅は20枠。

βから同じだけ下げると、74.50円がターゲットになります。

週末82円超えならば、シナリオ変更です。

If the market price will fall again, the move from “ALPHA” point was 20 boxes move.

If the market price will fall as same move from “BETA” point, the target price is 74.50yen.

And if the market price will go over 82.00yen in the weekend, we will change our scenario.


相場分析のリクエストがありましたら“Contact Us”からお知らせください。ご要望にお応えできるように努力いたします。

このブログはあくまでも個人的な見解であり、投資判断は各自でお願い致します。当ブログは一切の投資損益に対する責任を負いません。

ホームページに来て下さってありがとうございます。明日もよろしくお願いいたします。

If you have some request to analyze, please write to “Contact Us”.

We do best effort for your request.

These are only personal opinions on this blog, and you need the investment judgment in each one. This blog doesn’t assume the responsibility to all the investment profit and loss.

Thank for watching our contents. My best regards next day.


© 2025 Retar