本日はNY銀を分析します。
Today we analyze NY silver.
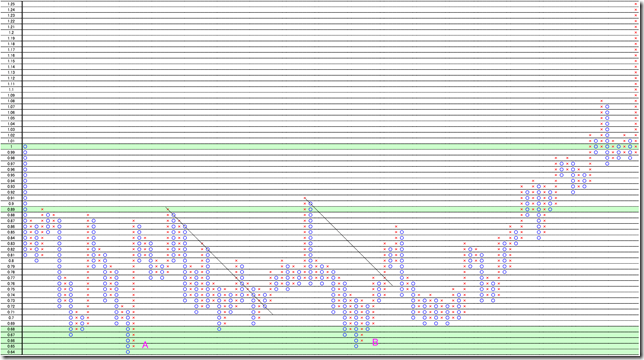
1974年高値からのP&Fです。
高値をとった後の新高値をとるまでの動きをチャートにしています。
書き出しは1974/5/15の6.236ポイントです。
チャートはこの値を1倍として書いております。
This is P&F from 1974 high.
This is the chart after the market price took highest and went over it.
The starting point is 5/15/1974 (6.236point).
We made the data as 1.00 point as 5/15/1974 close price.
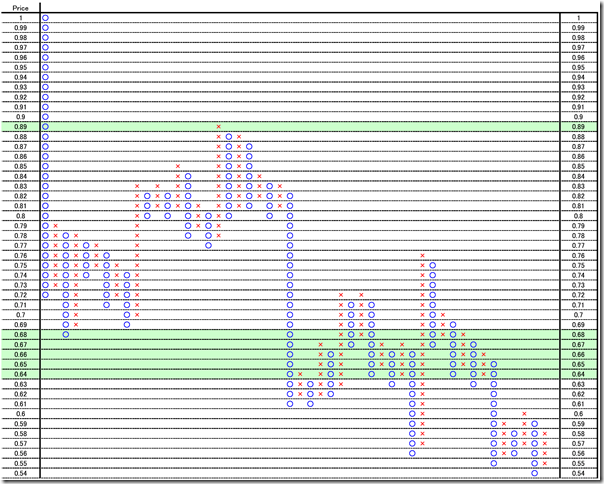
現在の高値からのP&Fです。
書き出しは2011/4/29の48.584ポイントです。
チャートはこの値を1倍として書いております。
This is the recent market P&F chart.
The starting point is 4/29/2011 (48.584point).
We made the data as 1.00 point as 4/29/2011 close price.
1974年のチャートの特徴はA点で安値をとった後、B点で安値に到達せず反転上昇したことです。
現在の相場は、安値を割り込んでいるため、底の確認が取れておりません。
The chart unique point is the market price did not cut “A” point low at “B” point in 1974.
The recent market cut the lowest and we do not know it may be the bottom.
共通点もあります。
- 戻り高値は89%です。
- 1974年の場合最安値からの安値計算をしてみますと4.6 * 0.64 = 2.94倍
- 最近の場合、最安値からの安値計算をしてみますと5.33 * 0.54 = 2.88倍
今回の底は安値から考えるといいところだと考えております。
And there are some similarities.
- The recovery high was 89%.
- In 1974 case, the lowest was 4.6 * 0.64 = 2.94 times.
- In the recent case, the lowest was 5.33 * 0.54 = 2.88 times.
In recent case, we think the bottom price reached the proper value.
相場分析のリクエストがありましたら“Contact Us”からお知らせください。ご要望にお応えできるように努力いたします。
このブログはあくまでも個人的な見解であり、投資判断は各自でお願い致します。当ブログは一切の投資損益に対する責任を負いません。
ホームページに来て下さってありがとうございます。明日もよろしくお願いいたします。
If you have some request to analyze, please write to “Contact Us”.
We do best effort for your request.
These are only personal opinions on this blog, and you need the investment judgment in each one. This blog doesn’t assume the responsibility to all the investment profit and loss.
Thank for watching our contents. My best regards next day.


