2012/07

豪ドル円・連日の陰陽の規則性適用なら下落/AUDJPY. If we apply black or white candle stick rule, the market price will fall.

2012/07/18

豪ドル円についてです。

マザーマーケットなのですが、オセアニア時間を抜いて書いています。

理由は分析の精度を高めるためなのですが、考えてみれば、マーケットの厚みの出る時間帯は東京時間帯中の出来事であることも影響していると考えられます。

This is AUDJPY chart.

This currency pairs contain mother market but we withdraw them.

The reason why is improving the analysis and this may effect on the liquidity problem.


本日は面白い規則性を発見しましたので報告します。

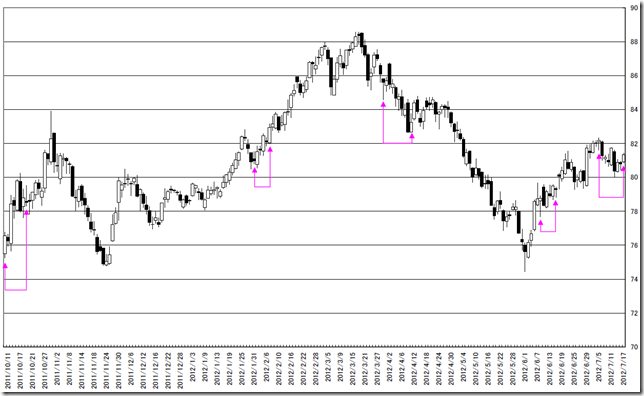
陰線と陽線の6営業日以上の連続を調査しました。

はじめの開始日の終値と終了日の終値を比較するとトレンドは以降、同じ方向に出ています。

現在は2012/07/05高値を基点に陰陽の連続を繰り返しています。

このまま、陰陰、陽陽の組み合わせが出現した場合、2012/07/05終値を抜けていないため下落する可能性が高くなります。

We find out unique rule.

We analyze the continuation of a black body and a white body of six business days or more.

Comparing of the first day’s close price and the end day’s close price, the following trend is same direction.

The continuation of recent market is still going on from 07/05/2012.

If black and black combination or white and white combination will appear in near future, the market price did not go over 07/05/2012 high; this means the market price will fall.

AUDJPY


相場分析のリクエストがありましたら“Contact Us”からお知らせください。ご要望にお応えできるように努力いたします。

このブログはあくまでも個人的な見解であり、投資判断は各自でお願い致します。当ブログは一切の投資損益に対する責任を負いません。

ホームページに来て下さってありがとうございます。明日もよろしくお願いいたします。

If you have some request to analyze, please write to “Contact Us”.

We do best effort for your request.

These are only personal opinions on this blog, and you need the investment judgment in each one. This blog doesn’t assume the responsibility to all the investment profit and loss.

Thank for watching our contents. My best regards next day.


NY金。下落を要警戒ですが、決めうちは禁物/ NY GOLD. We still think Gold market may fall but this is only highly possibility.

2012/07/17

本日はNY金を分析します。

Today we analyze NY gold.


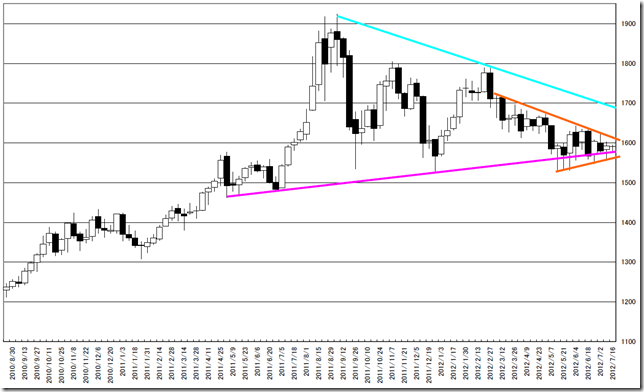
私たちは2012/06/24に「NY金週足。週足の重要なサポート割れ、下落を要警戒」というレポートを出しておりますが、未だに見方は変化しておりません。

先週末まで、10週連続の陰陽です。

むしろ下落なり、上昇なり起こったときはわかりやすく、力強いトレンドとして現れるものと予想しています。

We reported “The market price cut the important support; we think this may become a fall?” in 06/24/2012 and our view did not change.

The market price formed “BLACK-AND-WHITE” formation during 10 weeks.

We think the next trend will become obvious and strong.

01


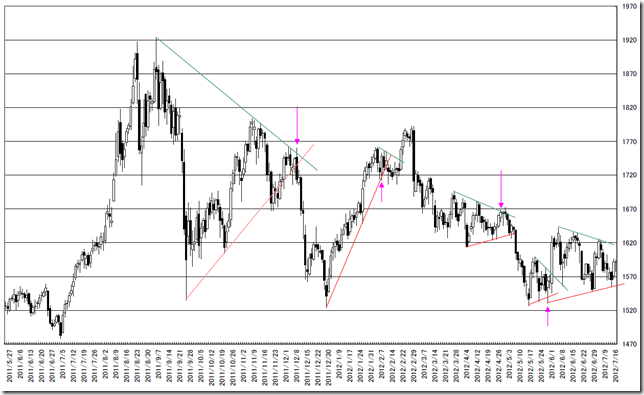
重要なトレンド発生は、日足のポイントに注目しています。

それ相応の長い期間のサポートとレジスタンスを引いたとき、ライン割れの小さなヒゲが大きなトレンド方向とは反対の動きになっていることに注目しています。

The next trend signal will reveal daily data first.

When we draw a trend line on the chart and watching the line cutting point on the chart with upper shadow, the proper trend direction came out the other direction of upper shadow point.

02


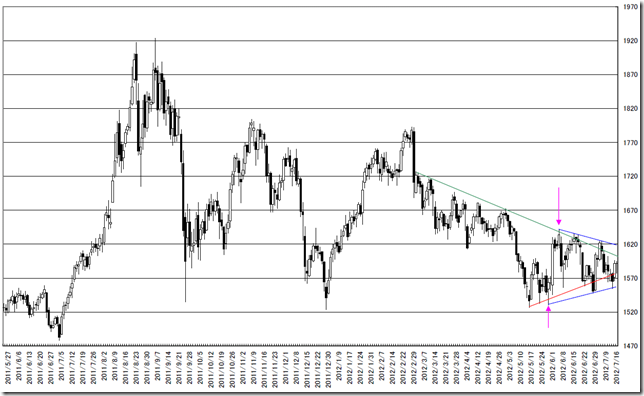
現在の相場ではサポートとレジスタンスは、上下を抑えられているためトレンドの発生方向は想定できません。(ピンク色の部分両方でトレンドラインを超えているからです。)

今後、水色線のヒゲ抜きが発生してから考えたいとおもいます。

また、大陽線または大陰線1本で抜くような動きであるならば、強いトレンドのシグナルとなるとも考えたいと思います。

The recent market did not appear the upper shadow; we can not imagine the market trend.

(See pink arrow point, these are cutting and we can not notice.)

If the market price will cut water color line, we may consider.

And if the big black or white candle stick will appear, this may become a signal.

03


相場分析のリクエストがありましたら“Contact Us”からお知らせください。ご要望にお応えできるように努力いたします。

このブログはあくまでも個人的な見解であり、投資判断は各自でお願い致します。当ブログは一切の投資損益に対する責任を負いません。

ホームページに来て下さってありがとうございます。明日もよろしくお願いいたします。

If you have some request to analyze, please write to “Contact Us”.

We do best effort for your request.

These are only personal opinions on this blog, and you need the investment judgment in each one. This blog doesn’t assume the responsibility to all the investment profit and loss.

Thank for watching our contents. My best regards next day.

© 2025 Retar