日経平均年足の分析(5)・今週1週間の値動きから察すると爆騰のハードルは高そう?
NIKKEI 225 annual No.5; Big jump may be difficult from this week price movement.
日经225。年K的分析。第5部。看从本周价格走势,大跳跃可能很难。
本日は日経平均年足についてです。
Today’s analyze is NIKKEI 225 annual.
2014/12/31のレポートでは「日経平均年足の分析(1)・来年は陽線坊主の可能性あり」と報告しました。
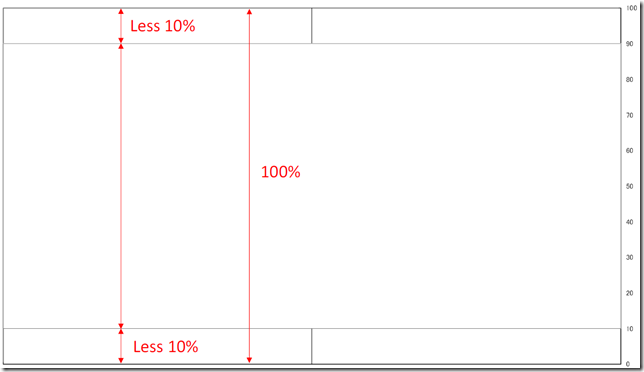
陽線坊主の定義とは以下になります。
- 年間の高値安値の値幅を100%とする。
- ろうそく足の上ヒゲが10%以下、下ヒゲが10%以下
We reported “NIKKEI 225 annual No.1; the next year may be white candle stick without shadow” in 12/31/2014.
The definition of “white candle stick without shadow” is under these.
- From high to low treat as 100%.
- The lower shadow and upper shadow are less than 10% of all.
さて、今週の始値17,325.68円、高値17,540.92円、安値16,808.26円、終値17,197.73円でした。
下ヒゲは ”17,197.73-16,808.26=389.47円” です。
つまり、2014/12/31のレポートでの定義を使うと、爆騰するためには、
2015年の高値は “17,325.68+(389.47*9)=20830.91円” 以上、
終値は “17,325.68+(389.47*8)=20441.44円” 以上を達成しないと陽線坊主の要件を満たすことができません。
Now, the last week price was Open: 17,325.68yen, High: 17,540.92yen, Low: 16,808.26yen and Close: 17,197.73yen.
The lower shadow is 17,197.73-16,808.26=389.47yen.
And using 12/31/2014 definition, if this year will be a big jump,
the highest will need “17,325.68+(389.47*9)=20830.91yen over”
and the close price will need “17,325.68+(389.47*8)=20441.44yen over”.
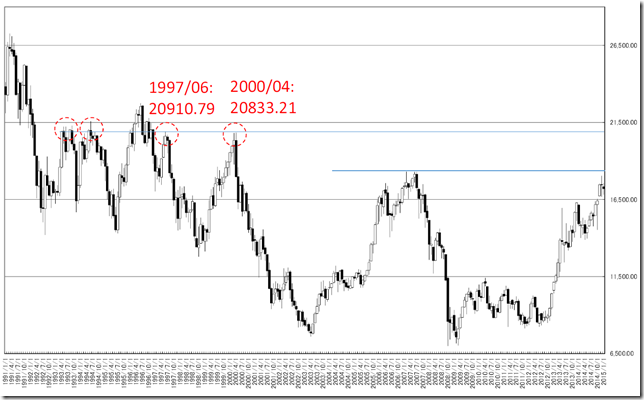
20830.91円は2000年4月の高値(20833.21円)とほとんど誤差がなく意味深です。
爆騰したけれども、1997/06の高値(20910.79円)とあわせてトリプルトップなどという洒落にならないシナリオも考えておく必要があります。
20830.91yen is very close to 04/2000 high (20833.21yen) and meaningful!
This year may be a big jump but will make a triple top (06/1997 high was 20910.79yen).
相場分析のリクエストがありましたら“Contact Us”からお知らせください。ご要望にお応えできるように努力いたします。
このブログはあくまでも個人的な見解であり、投資判断は各自でお願い致します。当ブログは一切の投資損益に対する責任を負いません。
ホームページに来て下さってありがとうございます。明日もよろしくお願いいたします。
If you have some request to analyze, please write to “Contact Us”.
We do best effort for your request.
These are only personal opinions on this blog, and you need the investment judgment in each one. This blog doesn’t assume the responsibility to all the investment profit and loss.
Thank for watching our contents. My best regards next day.
如果您需要行情分析,请点击“Contact Us”联系我们。我们将尽力满足您的要求。
本博客仅为个人意见,请各自做出投资判断。本博客概不对任何投资盈亏负责。
感谢您访问本博客。欢迎再次使用。


