日経平均年足の分析(4)・1989年以前の調査/3年で200%超の上げのせいで、あんまり上がんないかも
NIKKEI 225 annual No.4; survey of before 1989; 200% over jump may be the signal of not jumping.
日经225。年K的分析。第4部。1989年以前的调查。超过200%可能是没跳的信号。
本日は日経平均年足についてです。
1989年から1952年のデータについて調査しました。
結論は、強い3年連続上げの後に期待できる強い上げがなかったことがわかりました。
Today’s analyze is NIKKEI 225 annual.
We surveyed from 1989 to 1952.
Our conclusion is after three years continuous grow and next year strong bull was rare.
現在の状態を説明すると以下のようになるでしょう。
- 2012年の年初は8549.54円。2014年の終値は17450.77円。17450.77/8549.54=204%の上昇となりLONGならホクホク。
- 2013年の年初は10604.5円。2014年の終値は17450.77円。17450.77/10604.5=165%の上昇となりLONGならホクホク。
- 2014年の年初は16147.54円。2014年の終値は17450.77円。17450.77/16147.54=108%の上昇となりLONGならホクホク。
この3年間、LONGにしていれば、尻上がりに資産が増え、幸せであったということです。
本日はこの状態が、翌年の年末も継続するのか否かを調査しました。
Accounting for the latest situation is under these.
- The open price of 2012 was 8549.54yen. And the close price of 2014 was 17450.77yen. Taking long position, we are very happy; 17450.77/8549.54=204%.
- The open price of 2013 was 10604.5yen. And the close price of 2014 was 17450.77yen. Taking long position, we are very happy; 17450.77/10604.5=165%.
- The open price of 2014 was 16147.54yen. And the close price of 2014 was 17450.77yen. Taking long position, we are very happy; 17450.77/16147.54=108%.
In latest three years, taking long position make us happy.
We survey this happy condition will continue.
昨日は、1990年から2013年までの間では3/24回(13%)の珍しい現象であると紹介しましたが、本日は1952年から1989年までの38年間について調査しました。
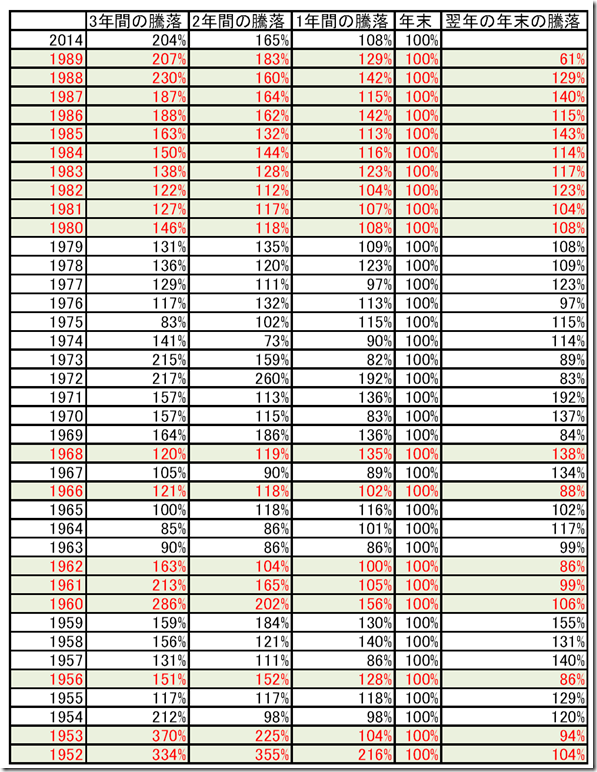
1952年から1989年の間で、3年間右肩あがりとなったのは18/38回(47%)あります。
1989年以前は、おおよそ半分の年末でベリーハッピーな正月を迎えていたことになります。
Last day, we surveyed form 1990 to 2013 and find out 13% (3/24) unique occasions and today, we surveyed 38 years from 1952 to 1989.
There are 47% cases (18/38) of three years continuous grow from 1952 to 1989.
Before 1989, we welcomed a very happy New Year almost in half cases.
では、3年間右肩あがりであった翌年のパフォーマンスがどのようになったか見てみましょう。
1952年から1989年の間で、3年間右肩あがりであった翌年の平均パフォーマンスは114%です。
2014年終値が17450.77 円であるため、平均的なパフォーマンスを取るなら17450.77*114%=19893.8778円(2015年終値想定)となります。
このうち、2012年から2014年の上昇率(17450.77/8549.54=204%)を超えるグループと超えないグループに分けて考えてみます。
大雑把な言い方をすると、3年で株価が2倍になるグループと、ならないグループに分けて調査するということになります。
1990年以降の24年間にはない現象です。
Now, let’s see how did it became the next year of three years continuous grow.
The average of three years continuous grow from 1952 to 1989 was 114%.
If 2015 close price will follow the average, 2015 close price will be 17450.77*114%=19893.8778yen. (2014 close price was 17450.77yen)
And we divide two types of group; going up 204% (17450.77/8549.54=204%; from 2012 to 2014) and not.
This rough meaning is the market price went up twice in three years and not.
This occasion was not occurred in 24 years from 1990 to 2013.
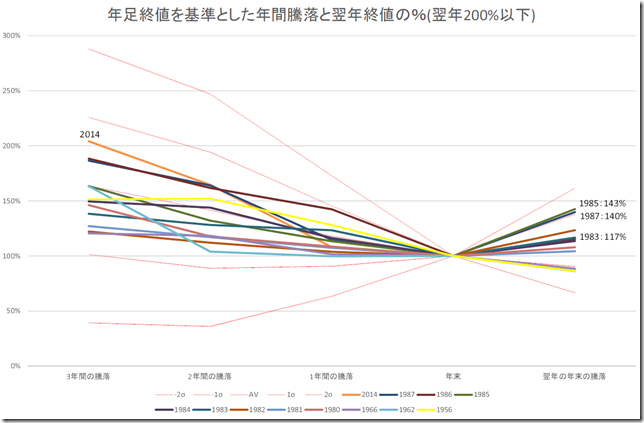
アンダーパフォームグループ/ Underperforming group
3年間上がって来ているけれども、2014年末よりも上げがマイルドであった場合です。
翌年の平均以上(114%以上)の例は6/11=55%です。
200%を切るケースでは半数以上が、4年目も上昇できました。
These groups are the next year of three years continuous grow and milder growth than 2014.
The exceeded average growth was 55% (6/11) cases.
Lower 200% cases, half cases over went over last year’s close price.
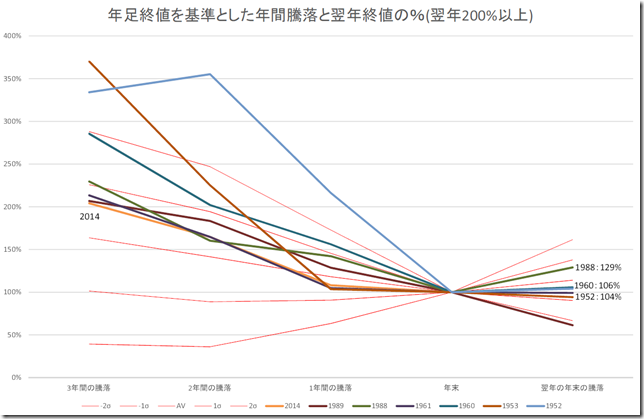
アウトパフォームするグループ / Outperforming group
3年間上がって来ているけれども、2014年末よりも上がったハッピーな場合です。
平均以上(114%以上)の例は1/6=17%です。
3年間上げたので息切れしているようにも見えます。
These groups are the next year of three years continuous grow and higher growth than 2014.
The exceeded average growth was 17% (1/6) cases.
The market price went up three years and seems to be short breath.
最大上昇/Best performed
3年上り坂の事例の中で最も上昇したのは、1951年から1953年にかけて(370%)です。
1953年の終値は377.95円、1954年の終値は356.09円で、377.95/356.09=94%。
2014年終値(17450.77円)の94%は、16404円です。
また、3年間の上げ相場が続いた後、最大あげたのは1983年から1985年にマイルドに上げた翌年の1986年で、143%の上昇(1986年終値18,701.30円、1985年終値は13,113.32円)となりました。
2014年終値(17450.77円)の143%は24955円です。
The best performed year was from 1951 to 1953.
And 1953 close price was 377.95yen and 1954 close price was 356.09yen; 377.95/356.09=94%
Applying to 2014 market, it is 17450.77*94%=16404yen.
And the best performed was from 1983 to 1985 (this case was very mild case) and 1986 performance was 143%. (1986 close price was 18,701.30yen and 1985 close price was 13,113.32yen.)
Applying to 2014 market, it is 17450.77*143%=24955yen.
相場分析のリクエストがありましたら“Contact Us”からお知らせください。ご要望にお応えできるように努力いたします。
このブログはあくまでも個人的な見解であり、投資判断は各自でお願い致します。当ブログは一切の投資損益に対する責任を負いません。
ホームページに来て下さってありがとうございます。明日もよろしくお願いいたします。
If you have some request to analyze, please write to “Contact Us”.
We do best effort for your request.
These are only personal opinions on this blog, and you need the investment judgment in each one. This blog doesn’t assume the responsibility to all the investment profit and loss.
Thank for watching our contents. My best regards next day.
如果您需要行情分析,请点击“Contact Us”联系我们。我们将尽力满足您的要求。
本博客仅为个人意见,请各自做出投资判断。本博客概不对任何投资盈亏负责。
感谢您访问本博客。欢迎再次使用。


