2015/01

日経平均年足の分析(3)・2015年終値想定・2005年並みなら18658円?・1995年並みなら17006円?/NIKKEI 225 annual No.3; The close price of 2015 estimate; 18658yen following 2005 and 17006yen following 1995. /日经225。年K的分析。第3部。2015年的估计的收盘价。要是类似于2005年,就收盘价可能会18,658日元。要是类似于1995年,就收盘价可能会17,006日元。

2015/01/02

日経平均年足の分析(3)・2015年終値想定・2005年並みなら18658円?・1995年並みなら17006円?

NIKKEI 225 annual No.3; The close price of 2015 estimate; 18658yen following 2005 and 17006yen following 1995.

日经225。年K的分析。第3部。2015年的估计的收盘价。要是类似于2005年,就收盘价可能会18,658日元。要是类似于1995年,就收盘价可能会17,006日元。


本日は日経平均年足についてです。

1990年以降のデータについて調査しました。

Today’s analyze is NIKKEI 225 annual.

We surveyed after 1990’s.


現在の状態を説明すると以下のようになるでしょう。

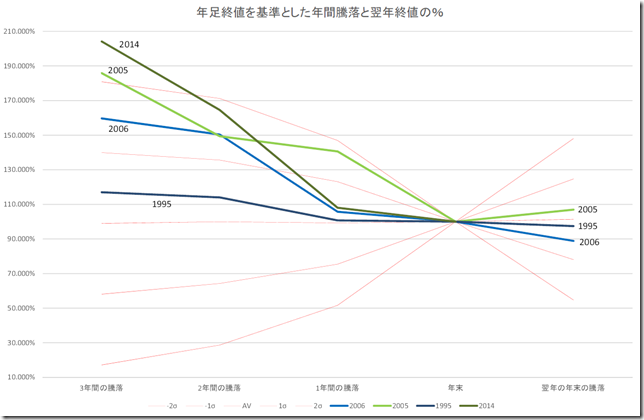
  • 2012年の年初は8549.54円。2014年の終値は17450.77円。17450.77/8549.54=204%の上昇となりLONGならホクホク。


  • 2013年の年初は10604.5円。2014年の終値は17450.77円。17450.77/10604.5=165%の上昇となりLONGならホクホク。


  • 2014年の年初は16147.54円。2014年の終値は17450.77円。17450.77/16147.54=108%の上昇となりLONGならホクホク。


この3年間、LONGにしていれば、尻上がりに資産が増え、幸せであったということです。

本日はこの状態が、翌年の年末も継続するのか否かを調査しました。


Accounting for the latest situation is under these.

  • The open price of 2012 was 8549.54yen. And the close price of 2014 was 17450.77yen. Taking long position, we are very happy; 17450.77/8549.54=204%.

  • The open price of 2013 was 10604.5yen. And the close price of 2014 was 17450.77yen. Taking long position, we are very happy; 17450.77/10604.5=165%.

  • The open price of 2014 was 16147.54yen. And the close price of 2014 was 17450.77yen. Taking long position, we are very happy; 17450.77/16147.54=108%.

In latest three years, taking long position make us happy.

We survey this happy condition will continue.


1990年以降、尻上がりに資産が増えた3年間の組み合わせは、1995年、2005年、2006年となります。

これの意味は、1990年から2013年の24年の中で年末にLONGを持っていて、3年間の右肩上がりを体験できたのは3年しかありません。

そのほかの年末年初というのは、3年間のどこかで資産の目減りに見舞われたということです。

4年連続の上げを達成できたのは、2003,2004,2005,2006の組み合わせだけです。

2015年の終値が2005年並みの上昇ならば18658円、1995年並みの下落となるならば17006円となります。

After 1990, continuous asset growing up combination is 1995, 2005 and 2006.

The meaning of this is taking long position at the end of the year in from 1990 to 2013, growing year are only three cases.

The others, we need to feel draw down in these three years.

From 2003 to 2006 is the only case of growing in four years.

If the market price will follow the 2005’s jump, the 2015’s close price will 18658yen and if the market price will follow the 1995’s fall, the 2015’s close price will 17006yen.

CHART


相場分析のリクエストがありましたら“Contact Us”からお知らせください。ご要望にお応えできるように努力いたします。

このブログはあくまでも個人的な見解であり、投資判断は各自でお願い致します。当ブログは一切の投資損益に対する責任を負いません。

ホームページに来て下さってありがとうございます。明日もよろしくお願いいたします。

If you have some request to analyze, please write to “Contact Us”.

We do best effort for your request.

These are only personal opinions on this blog, and you need the investment judgment in each one. This blog doesn’t assume the responsibility to all the investment profit and loss.

Thank for watching our contents. My best regards next day.

如果您需要行情分析,请点击“Contact Us”联系我们。我们将尽力满足您的要求。

本博客仅为个人意见,请各自做出投资判断。本博客概不对任何投资盈亏负责。

感谢您访问本博客。欢迎再次使用。


日経平均年足の分析(2)・2013、2014年と1960、1961年の相場の奇妙な一致。2015年の終値は17285円?/NIKKEI 225 annual No.2; there is a similarity between 2013-2014 market and 1960-1961 market; The close price of 2015 may be 17285yen? /日经225。年K的分析。第2部。有2013年-2014年市场和1960年-1961年市场之间的相似性。2015年的收盘价可能17285日元呢?

2015/01/01

日経平均年足の分析(2)・2013、2014年と1960、1961年の相場の奇妙な一致。2015年の終値は17285円?

NIKKEI 225 annual No.2; there is a similarity between 2013-2014 market and 1960-1961 market; The close price of 2015 may be 17285yen?

日经225。年K的分析。第2部。有2013年-2014年市场和1960年-1961年市场之间的相似性。2015年的收盘价可能17285日元呢?


新年あけましておめでとうございます。

A Happy New Year!

SAPPORO

Moiwa,Sapporo


本日は日経平均年足についてです。

1950年以降のデータについて調査しました。

2014/12/31のレポートでは、「4/5は良いパフォーマンスですが、1962年だけがマイナスでした」と報告しています。

2014/12/31の日本経済新聞朝刊の12ページでも「日経平均が2万8000円に上昇すると予想する」とビックリ予想をしているアナリストもいます。

ところが、2013、2014年の年間パフォーマンスと1960、1961年の年間パフォーマンスは妙に似ています。

Today’s analyze is NIKKEI 225 annual.

We surveyed after 1950’s.

We reported “4/5 are good performance but only 1962 was bad” in 12/31/2014.

And some analyst says “N225 will jump to 28000yen” in the morning edition of NIKKEI paper in 12/31/2014.

But the performance between 2013-2014 and 1960-1961 is very similar.


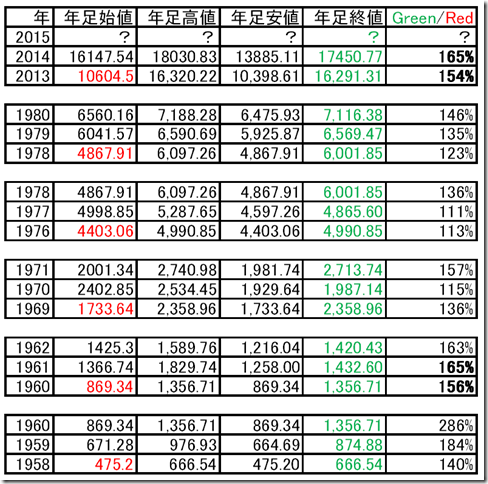
テーブルは昨日取り上げた3年間の値動きを追ったものです。

赤字のOPENから、各年の終値がどれだけ上げ下げしたかをまとめました。

仮に2015年の終値が28000円になるとするなら264%となり、1960年と同様に286%上昇するなら30329円ということになります。

2013、2014年の年間パフォーマンスと1960、1961年の年間パフォーマンスは似ています。(ボールド)

2015年が1962年と同様のパフォーマンスとなるならば、終値10604.5*163%=17285円となります。

This is the table of 3 years we reported last day.

This table focus on the close price performance from the red open price.

If the 2015’s close price will be 28000yen, the Green/Red will be 264% and if the market price will perform 286% such as 1960, the market close price will be 30329yen.

There is a similarity between 2013-2014 and 1960-1961. (Bold)

If the market price will perform as 1962 in 2015, the 2015’s close price will be 10604.5*163%=17285yen.

table


相場分析のリクエストがありましたら“Contact Us”からお知らせください。ご要望にお応えできるように努力いたします。

このブログはあくまでも個人的な見解であり、投資判断は各自でお願い致します。当ブログは一切の投資損益に対する責任を負いません。

ホームページに来て下さってありがとうございます。明日もよろしくお願いいたします。

If you have some request to analyze, please write to “Contact Us”.

We do best effort for your request.

These are only personal opinions on this blog, and you need the investment judgment in each one. This blog doesn’t assume the responsibility to all the investment profit and loss.

Thank for watching our contents. My best regards next day.

如果您需要行情分析,请点击“Contact Us”联系我们。我们将尽力满足您的要求。

本博客仅为个人意见,请各自做出投资判断。本博客概不对任何投资盈亏负责。

感谢您访问本博客。欢迎再次使用。

© 2025 Retar