日経平均日足・天王山・新高値ならBullトレンド・下落基点にもなりやすい
NIKKEI 225 daily; The watershed; Taking new high will mean a start of new bull trend and may start of bear trend.
日经225。分水岭。要是新高价,就将意味着新的看涨趋势开始。然而可能开始的看跌趋势。
山高く谷深し。
2015/06/24のレポートでは「日経平均計算値・中長期では21300円付近がターゲット」と報告しています。
週末終値から、ほんの800円ぐらい上です。
しかし、それが本当に遠くなるのも相場。
The peak will be higher, the ravine will be deeper.
We reported “NIKKEI 225 calculation; Mid to long term; 21300yen around will be target” in 06/24/2015.
This is only about 800yen from the last week end close price.
But it often becomes really far.
結論はトレンドがハッキリする天王山。
新高値を明らかにとってくるようであれば、上方向の離れとなります。
一方、下落波動の開始となっても納得できる局面です。
この点は、2015/08/15のレポート「日経平均週足・過去の羽黒15(11)号線・包み線・実体抜きがトレンド」とも符合します。
Our conclusion is this week will be the watershed of the market.
If the price will take new high, a new rally will start.
On the other hand, this week may start a new bear trend.
We reported “NIKKEI 225 weekly is “HAGURO” No.15 (11) formation; Cutting “Inside day” with body will be trend” in 08/15/2015 and this conclusion fits.
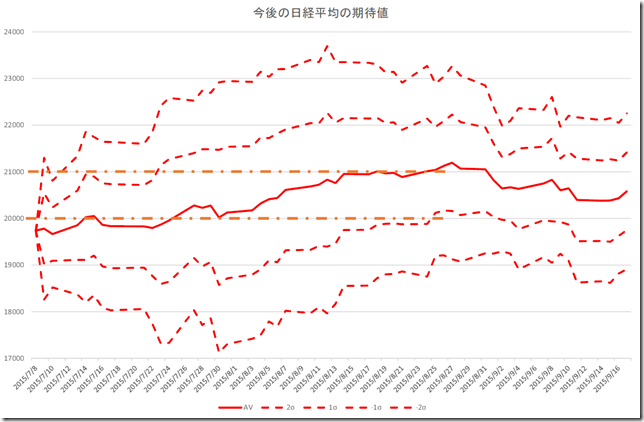
2015/07/09のレポートでは「日経平均日足・大きく下げた後の値動き・最短で8月中旬に21000円到達のシナリオもありか」と報告しています。
この日のレポートで示した回復力の期待値は8月下旬まで残っており(バンドが上向き)、現在は戻りの最後の時間帯です。
この値はあくまでも平均値であり、問題はこの勢いを月末まで維持できるかです。
We reported recovery power exists at the end of Augusts (Band directs upside) and now is the last phase of recovery.
This analyses means the average off recovery and we do not know bull trend will continue at the end of this month.
2015/07/08のレポートでは「日経平均日足・2015/07/14までに下げ止まるか、2015/07/16までに下げ止まるかで今後が見える」と書きました。
相場は2014/07/09に下げ止まったため、下げ続けることにはならず高値持ち合いを維持しています。
And the market price stopped falling in 07/09/2015 and made steadiness.
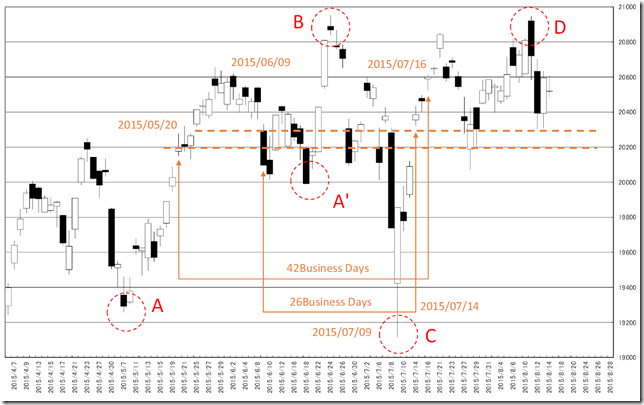
注目するべき点は、ここで発生したのはA-B-C-D、A’-B-C-Dの組み合わせによる下落波動です。
現在の相場はB-Cにかけてのハラミ、またB地点とD地点の差は、わずか5.78円しかありません。
20952.71円を実体で抜くような新高値を取る陽線を出せばそれは、まぎれもないブルトレンドとなりそうです。
しかし、下落波動の力が強く、新高値が取れない状況になれば、天井感が出てくる局面です。
The notable point is the wave of “A-B-C-D” and “A’-B-C-D” and this is down side wave.
The latest market, the price runs inside of “B-C” and the price range is only 5.78 yen,
And if the market price will take 20952.71 yen over with white candle stick body, this will be a start of bull trend.
But down side waver power will be stronger and cannot take new high, this market may peak out.
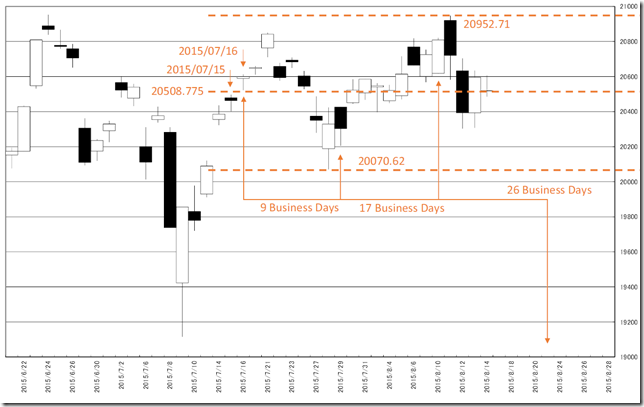
一番の注目はハラミとなる持ち合いからの離れです。
基点日は、窓に中間値があるため2015/07/15、2015/07/16となります。
今週末に基点からの26営業日を迎えるため、注意を要するところです。
The most notable point is launching from the steadiness.
The starting point is gaped point and they are 07/15/2015 and 07/16/2015.
At the end of this week, the market will reach 26 business days and this may be the launching point.
相場分析のリクエストがありましたら“Contact Us”からお知らせください。ご要望にお応えできるように努力いたします。
このブログはあくまでも個人的な見解であり、投資判断は各自でお願い致します。当ブログは一切の投資損益に対する責任を負いません。
ホームページに来て下さってありがとうございます。明日もよろしくお願いいたします。
If you have some request to analyze, please write to “Contact Us”.
We do best effort for your request.
These are only personal opinions on this blog, and you need the investment judgment in each one. This blog doesn’t assume the responsibility to all the investment profit and loss.
Thank for watching our contents. My best regards next day.
如果您需要行情分析,请点击“Contact Us”联系我们。我们将尽力满足您的要求。
本博客仅为个人意见,请各自做出投资判断。本博客概不对任何投资盈亏负责。
感谢您访问本博客。欢迎再次使用。


