2017/02

NY金月足・1月大陽線・今月陽線だと鉄板底の確認/NY GOLD Monthly; January was big white candle stick; when this month will become white candle stick, we can be bullish. /纽约黄金。一月大阳烛棒。如果这个月是阳烛棒,就可以牛市。

2017/02/12

NY金月足・1月大陽線・今月陽線だと鉄板底の確認

NY GOLD Monthly; January was big white candle stick; when this month will become white candle stick, we can be bullish.

纽约黄金。一月大阳烛棒。如果这个月是阳烛棒,就可以牛市。


「ドラッケンミラー氏:昨年12月に金を購入-従来の投資姿勢を転換」(Bloomberg 2017/2/8)

“Druckenmiller Bought Gold After Reversing November Stance”(Bloomberg 2/8/2017)


本日はNY Goldについてです。

「NY金日足・1980年代に倣うと、まもなく1200ポイント超え失敗のはずだが? 1130ポイントを守り切ると景色が変わる」(2017/1/11レポート)

「既に景色が変わっているとみています。」(2017/1/31レポート)

Today is about NY Gold.

We reported “NY GOLD Daily; following 1980’s, the price will challenge 1200 point over and will fail; if the 1130 point around will work as support condition will change” in 1/11/2017.

And we reported “We think this market trend seems to have already changed” in 1/31/2017.


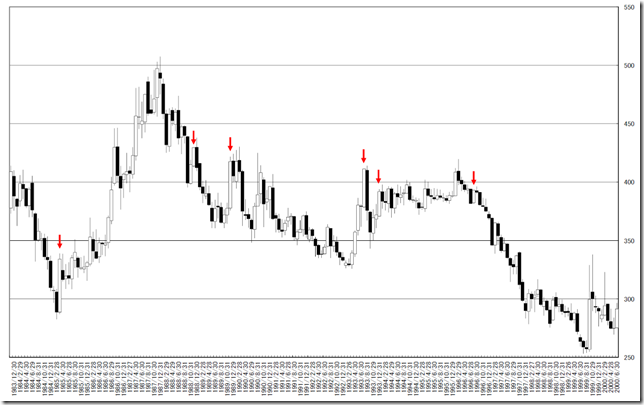
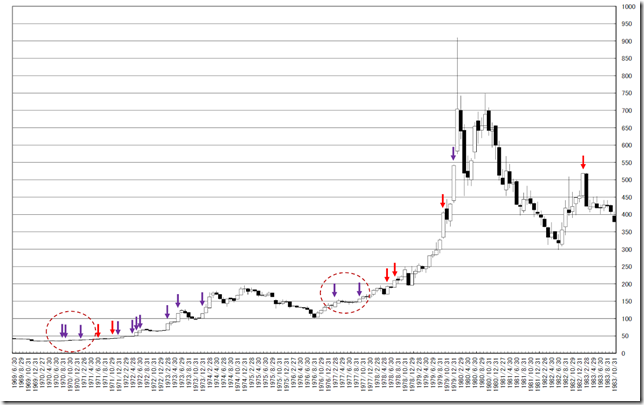
チャートのほぼ大陽線の地点に赤と紫の矢印を入れています。

大陽線の翌月が陽線の地点は紫、陰線の地点は赤を入れています。

注目すべきは、紫の地点です。

今月陽線だと、大陽線の翌月に陽線を立てたのは、2011/1以来になります。

特に久しぶりに発生した丸の地点は、上げ相場の初動を現しており、底堅さを示す型です。

たとえ2017/3が陰線となっても、その後の上げに比べれば「頭と尻尾」となる可能性を秘めます。

We mark almost “White candle stick without lower and upper shadow points”.

And when the next month is white candle stick, we mark as purple and when the next month is black candle stick, we mark as red.

The notable points are purple points.

If this month will become white candle stick, this occasion was since 1/2011.

And circle points are start of bull trend and this occasion implied “Iron plated” bottom.

Ever when the candle stick color will become “Black”, lower side will be limited and it will be a great chance for buy.

chart1

chart2

chart3


相場分析のリクエストがありましたら“Contact Us”からお知らせください。ご要望にお応えできるように努力いたします。

このブログはあくまでも個人的な見解であり、投資判断は各自でお願い致します。当ブログは一切の投資損益に対する責任を負いません。

ホームページに来て下さってありがとうございます。明日もよろしくお願いいたします。

If you have some request to analyze, please write to “Contact Us”.

We do best effort for your request.

These are only personal opinions on this blog, and you need the investment judgment in each one. This blog doesn’t assume the responsibility to all the investment profit and loss.

Thank for watching our contents. My best regards next day.

如果您需要行情分析,请点击“Contact Us”联系我们。我们将尽力满足您的要求。

本博客仅为个人意见,请各自做出投资判断。本博客概不对任何投资盈亏负责。

感谢您访问本博客。欢迎再次使用。


日経平均週足・羽黒4号線・2008/5/26の週との不気味な共通点/NIKKEI 225 weekly is “HAGURO” No.4 formation; Now seem to be Déjà vu of 5/26/2008 week. /日经225。羽黑4号线。现在似乎是2008年5月26号的周。

2017/02/10

日経平均週足・羽黒4号線・2008/5/26の週との不気味な共通点

NIKKEI 225 weekly is “HAGURO” No.4 formation; Now seem to be Déjà vu of 5/26/2008 week.

日经225。羽黑4号线。现在似乎是2008年5月26号的周。


結論は不気味な様相の足を出しています。

Our conclusion is now seems to beware of occasions.


2017/1/13のレポート「日経平均週足・羽黒9号線・上放れしそう。新高値から買いたい」はなお有効です。

今年の重要標語は「心に刻もう19592.9円と19114.37円」(2017/1/4レポート)と報告しており、19600円台を回復すると悪いシナリオが消えます。

In 1/13/2017, we reported “NIKKEI 225 week; “HAGURO” No.9 formation; rally seems to re-start and will follow from new high” and this report is still valid.

We reported “Let’s remind many times in this year, “We will remember 19592.9yen and 19114.37yen”” in 1/4/2017 and when the close price will go 19600yen over, bad scenario will not come true.


日経225週足線は羽黒4号線となりました。

日経225週足線では600週で羽黒4号線は52回出現しています。

基本的にブルトレンドで出る足です。

また、下落相場では、下げ止まりの確認などで示現する足です。

こちらの解説は、2017/1/27のレポートを参照願います。

In this week, N225 formed “HAGURO” No. 4 formation.

In past 600 weeks, N225 price formed “HAGURO” No. 4 formation was 52 times.

This formation implies “now is bull trend” and we can confirm the end of bear trend.

Please read 1/27/2017 report.

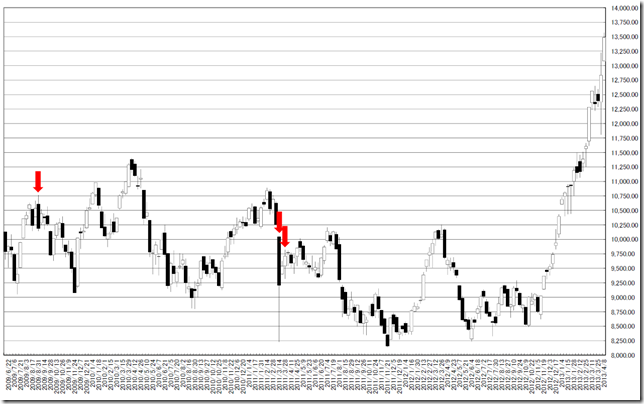
chart1


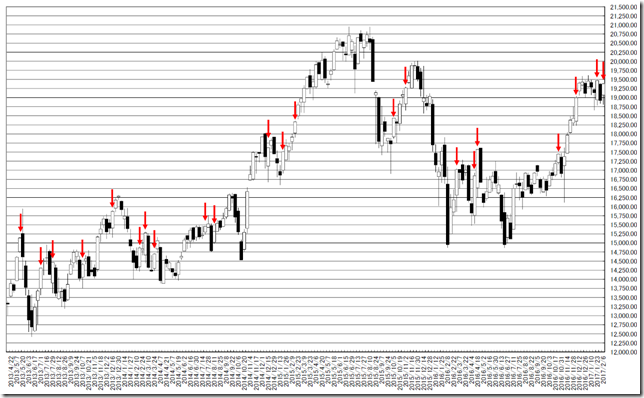
今週の注目点で最も熱いのは2週連続のハラミです。

2週連続のハラミからはトレンドの発生がありました。

ただし、ちょっとした上値遊びの後の下落など、ダマシもあるため注意が必要です。

This week is two weeks continuous “Inside day”.

A major trend appeared from at such points.

But the price movement was faked and we need to take care.


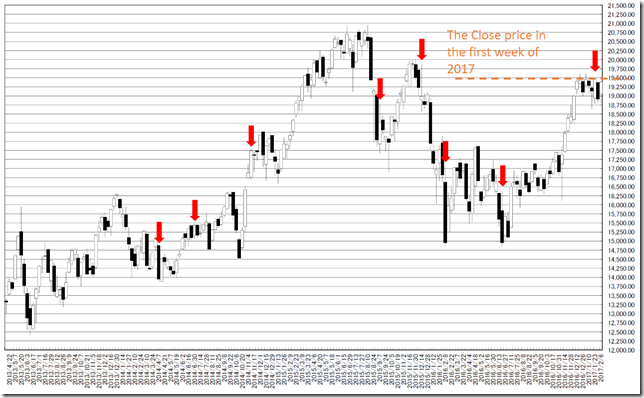
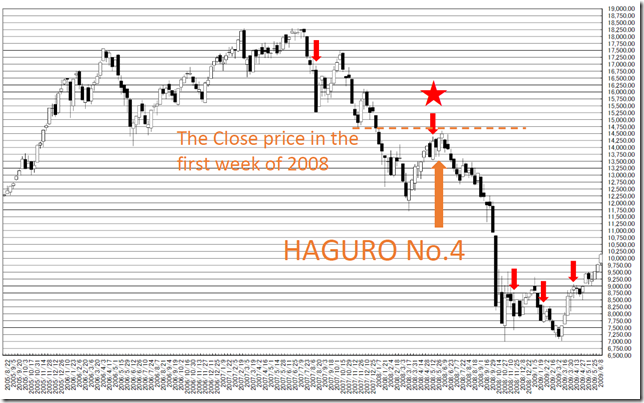
問題は星の地点です。(2008/5/26の週)

翌週は少しだけ上値を試しましたが、後は奈落となりました。

今週とのデジャブは、羽黒4号線だったこと、そして、年初の週のクローズがレジスタンスとして働いた点です。

「日経平均週足・羽黒4号線・新高値からは買いだが、既に大天井を打っている可能性あり」(2017/1/27)では、羽黒4号線の別の性質についても解説しています。

イヤーな予感満点である点だけは強調しておきたいと思います。

The notable point is start point. (5/26/2008 week)

The price challenged upside little but it was recovery high.

There are similar points to this week; “HAGURO” formation was same and the close price in the first week of the year works as resistance.

We reported “NIKKEI 225 weekly is “HAGURO” No.4 formation; This market may have already taken major peak and new high will be a start of bull trend” in 1/27/2017.

We have a bad feeling and may need to prepare for worst scenario.

chart2

chart3

chart4


相場分析のリクエストがありましたら“Contact Us”からお知らせください。ご要望にお応えできるように努力いたします。

このブログはあくまでも個人的な見解であり、投資判断は各自でお願い致します。当ブログは一切の投資損益に対する責任を負いません。

ホームページに来て下さってありがとうございます。明日もよろしくお願いいたします。

If you have some request to analyze, please write to “Contact Us”.

We do best effort for your request.

These are only personal opinions on this blog, and you need the investment judgment in each one. This blog doesn’t assume the responsibility to all the investment profit and loss.

Thank for watching our contents. My best regards next day.

如果您需要行情分析,请点击“Contact Us”联系我们。我们将尽力满足您的要求。

本博客仅为个人意见,请各自做出投资判断。本博客概不对任何投资盈亏负责。

感谢您访问本博客。欢迎再次使用。

© 2025 Retar