日経平均年足の分析(4)・今年の重要標語は「心に刻もう19592.9円と19114.37円」・年前半は堅調かも
NIKKEI 225 annual No.4; Let’s remind many times in this year, “We will remember 19592.9yen and 19114.37yen”; First half of year may be surprisingly bullish.
日经225。年K的分析(4)。19600日元和19100日元将抵抗和支持。今年上半年可能会牛市。
今年の重要標語は「心に刻もう19592.9円と19114.37円」。
Let’s remind many times in this year, “We will remember 19592.9yen and 19114.37yen”.
本日は2016年の高値と終値の攻防について調査しました。
結論は、上げるにしても下げるにしても19600円と19100円は値段の節になりそう。
また、19600円を超えて、その後割り込まないようであれば、年前半は意外と堅調そうな気配です。
過去に倣うなら、黒鳥さん来襲のような、ガリッとした下げは年後半の可能性が高いかもしれません。(2017/01/02レポート参照)
Today, we survey the meaning of the highest and the close price in 2016.
Our conclusion is 19600yen around and 19100yen around will be resistance and support point.
And cutting 19600yen and confirming it will work as support, first half of the year may be surprisingly bullish.
When the price will follow the past market price movement, a big fall such as “A Black Swan” will come later in the year. (See 01/02/2017 report)
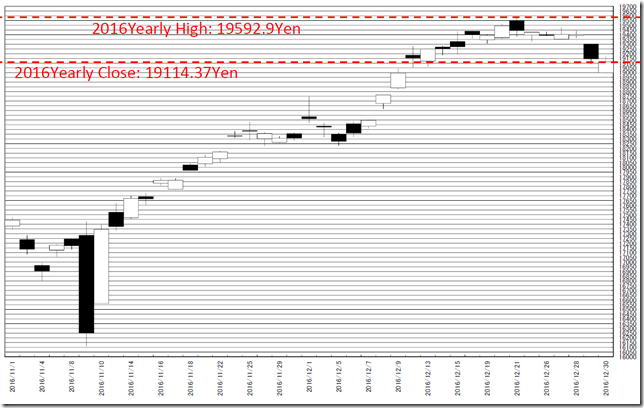
はじめに昨年の終値と高値の関係です。
This is the highest and close price in 2016.
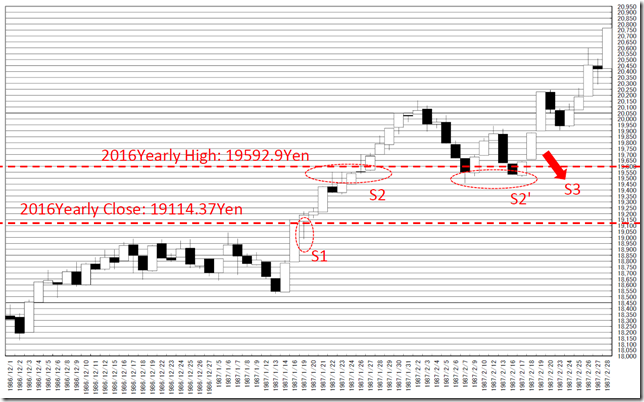
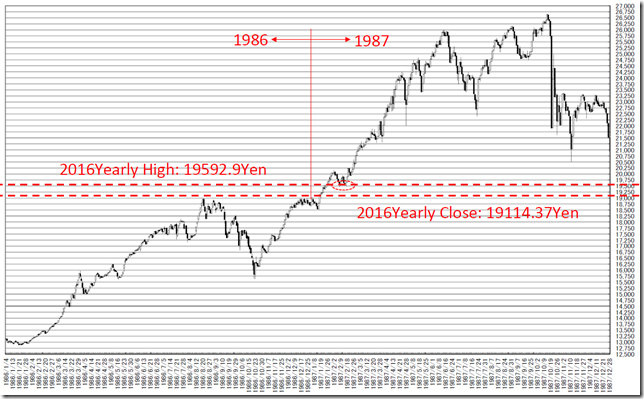
1986年から1987年にかけての値動きです。
昨年の終値と高値を書き入れてみると過去にも同じような価格帯がレジスタンスとサポートとして機能していました。
S1の地点では、サポートとして機能していました。
S2,S2’ではレジスタンスとサポート。
S3付近から下落に転じずに上昇へと向かいました。
もう一点の注目は1987年後半にガリッと下げていった点です。
This is the price movement from 1986 to 1987.
Adding the highest and close price in 2016, we can know the same price worked as resistance and support.
At “S1” point, this zone worked as support.
At “S2” and “S2’” point, this zone worked as support.
At “S3” point, the price did not fall and started big rally.
Additionally, we can know the price felled in later in 1987.
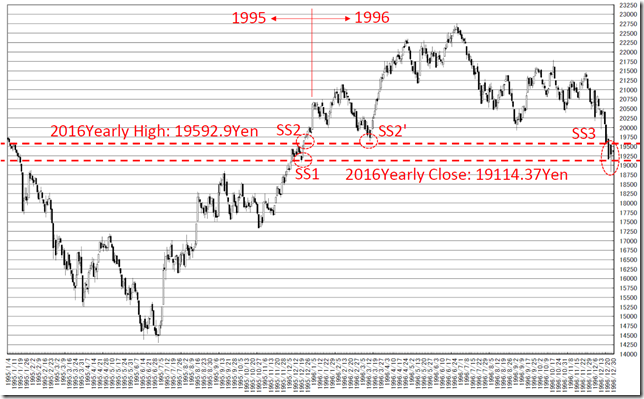
1995年から1996年にかけての値動きです。
SS1では、サポートとして機能していました。
SS2,SS2’ではレジスタンスとサポート。
SS3では、レジスタンスとして見事に機能しています。
1996年も年後半にシャープな下げとなっています。
This is the price movement from 1995 to 1996.
At “SS1” point, this zone worked as support.
At “SS2” and “SS2’” points, this zone worked as resistance.
At “SS3” point, this zone worked as proper resistance.
Moreover, we can know the price felled in later in 1996.
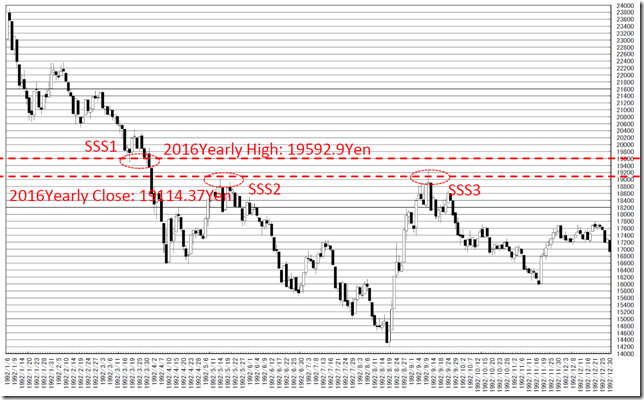
下落局面の1992年も見事なレジスタンスおよびサポートぶりです。
Bearish market in 1992, this zone worked as proper resistance.
相場分析のリクエストがありましたら“Contact Us”からお知らせください。ご要望にお応えできるように努力いたします。
このブログはあくまでも個人的な見解であり、投資判断は各自でお願い致します。当ブログは一切の投資損益に対する責任を負いません。
ホームページに来て下さってありがとうございます。明日もよろしくお願いいたします。
If you have some request to analyze, please write to “Contact Us”.
We do best effort for your request.
These are only personal opinions on this blog, and you need the investment judgment in each one. This blog doesn’t assume the responsibility to all the investment profit and loss.
Thank for watching our contents. My best regards next day.
如果您需要行情分析,请点击“Contact Us”联系我们。我们将尽力满足您的要求。
本博客仅为个人意见,请各自做出投资判断。本博客概不对任何投资盈亏负责。
感谢您访问本博客。欢迎再次使用。

