2017/05

日経平均日足・超長期波動の変化日は5月末に集中/NIKKEI 225 daily; “HENKABI” are concentrated at the end of this month. /日经225。長期的“变化日”集中在5月底。

2017/05/16

日経平均日足・超長期波動の変化日は5月末に集中

NIKKEI 225 daily; “HENKABI” are concentrated at the end of this month.

日经225。長期的“变化日”集中在5月底。


本日は日経225超短期日足についてです。

結論は「超長期波動の変化日は月末に集中」。

Today is about N225 daily.

Our conclusion is “HENKABI” are concentrated at the end of this month.


日柄のレポートは復習つきで解説していきます。

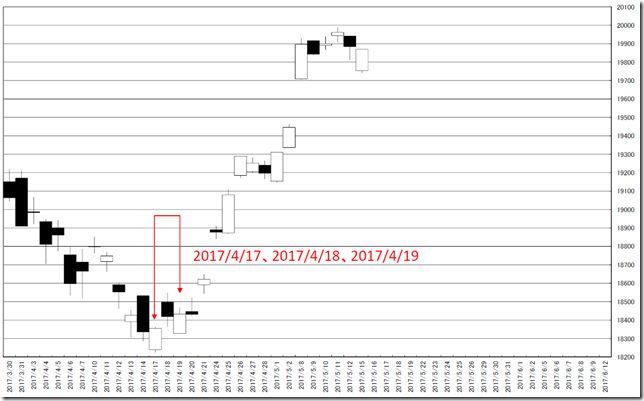
「日経平均日足短期・2017/4/17-19は強烈な変化時間帯」(2017/4/11)

反転リバーサルゾーンをとらえていました。

We review our past “HIGARA” report in any time.

We reported “NIKKEI 225 daily; From 4/17/2017 to 4/19/2017 will be Big “HENKABI” zone” in 4/11/2017.

This was the perfect reversal zone.

chart0


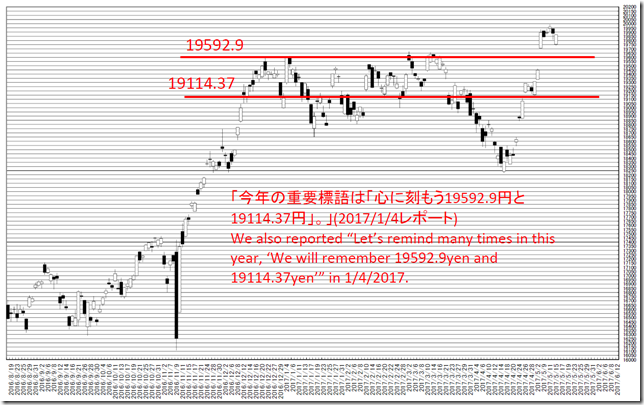
今年の重要標語は「心に刻もう19592.9円と19114.37円」。」(2017/1/4レポート)

今のところ窓となっており、「待っているわ♡♡♡」状態だとみています。

We also reported “Let’s remind many times in this year, ‘We will remember 19592.9yen and 19114.37yen’” in 1/4/2017.

This zone was gapped and the price will touch around this zone.

chart1


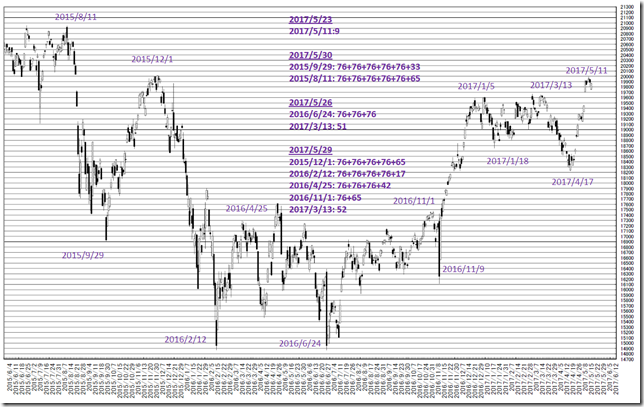
メジャーな頂点からの変化日の位置です。

長期の変化日の位置が月末に集中します。

特に2016/6/24の底からの76+76+76を達成するため、相場の変調があっても良い地点だとみています。

This is the “HENKABI” from the major peaks.

“HENKABI” are concentrated at the end of this month.

Especially, it will take 76+76+76 business days from 6/24/2016 and the market condition may change this zone around.

chart2


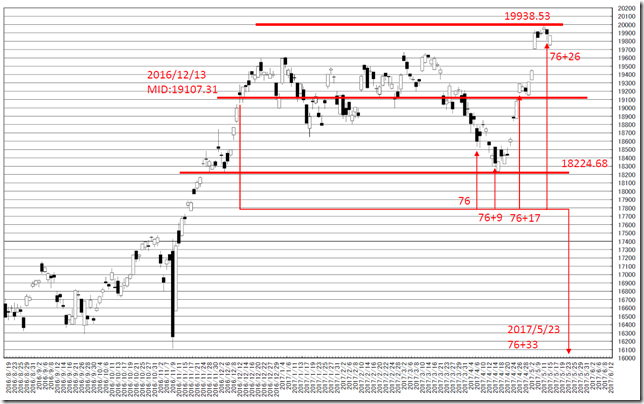
2016/12/13を基点とした持ち合いです。

注目は、あとからわかることですが、76手でレンジからの下離れている点です。

レンジが正確にとられている可能性が高まります。

また、76+9手で下げ止まらず、76+33手前にピークアウトしている点にも注目です。

弱気を示唆している可能性があり、注意を要します。

This is steadiness from 12/13/2016.

Notable point is the falling start was 76 business days but this is only we can know later.

This occasion often means our range estimation often proper.

And the price did not stop falling in 76+9 business days and peaked out before 76+33 business days and this occasion often suggests bearish market.

chart3


相場分析のリクエストがありましたら“Contact Us”からお知らせください。ご要望にお応えできるように努力いたします。

このブログはあくまでも個人的な見解であり、投資判断は各自でお願い致します。当ブログは一切の投資損益に対する責任を負いません。

ホームページに来て下さってありがとうございます。明日もよろしくお願いいたします。

If you have some request to analyze, please write to “Contact Us”.

We do best effort for your request.

These are only personal opinions on this blog, and you need the investment judgment in each one. This blog doesn’t assume the responsibility to all the investment profit and loss.

Thank for watching our contents. My best regards next day.

如果您需要行情分析,请点击“Contact Us”联系我们。我们将尽力满足您的要求。

本博客仅为个人意见,请各自做出投资判断。本博客概不对任何投资盈亏负责。

感谢您访问本博客。欢迎再次使用。


ドル円1時間足・レジスタンス114.30-20円、115.20-40円、サポート112.60円・天井を打った可能性あり/USDJPY hourly; Support are 112.60yen and resistance are 114.30-20yen and 115.20-40yen; this market may be peaked out. /美元/日元。阻力是114.30-114.20日元和115.20-115.40日元。支持是112.60日元。这个市场可能会高峰。

2017/05/15

ドル円1時間足・レジスタンス114.30-20円、115.20-40円、サポート112.60円・天井を打った可能性あり

USDJPY hourly; Support are 112.60yen and resistance are 114.30-20yen and 115.20-40yen; this market may be peaked out.

美元/日元。阻力是114.30-114.20日元和115.20-115.40日元。支持是112.60日元。这个市场可能会高峰。


本日はドル円についてです。

結論は、一旦買い方やめ、新高値から上値余地あり。

中長期では弱気でも、弱気になるためには時間がかかる相場もあります。

Today, we analyze USDJPY.

Our conclusion is we should stop long position and new high will start a new rally.

We are bearish in mid-to-long term but we need more time.


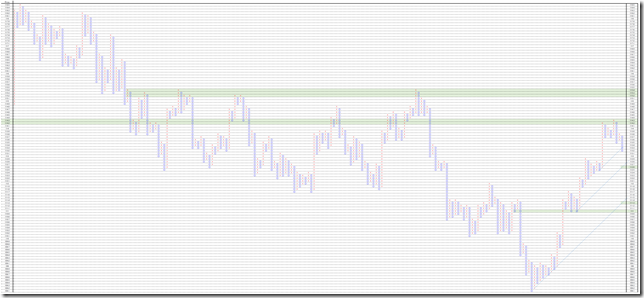
1枠0.1円、3枠転換の終値ポイントアンドフィギュアです。

1時間足を使用しオセアニア時間帯を省いています。

45度線を切ったため、一旦買い方やめです。

114円LOWのレジスタンスは薄い部分なので上方に突破する可能性を秘めるため、新高値からはついていきたい局面です。

ただし、115円ミドルは強力そうなレジスタンスなので、そこまででしょう。

下方向へのサポートは112円ミドル、111円LOW。

This is 0.1 price change and 3 box reversal close price’s Point and Figure chart.

We used hourly data and the Oceania time zone market price is pulled out.

The market price cut the 45 degree support and we should stop buying once.

114yen low seems to weak resistance and may be re-rally; we will follow from new high.

But 115yen middle seems to be strong resistance and this zone will work well.

The support zones are 112yen middle and 111yen low.

PF


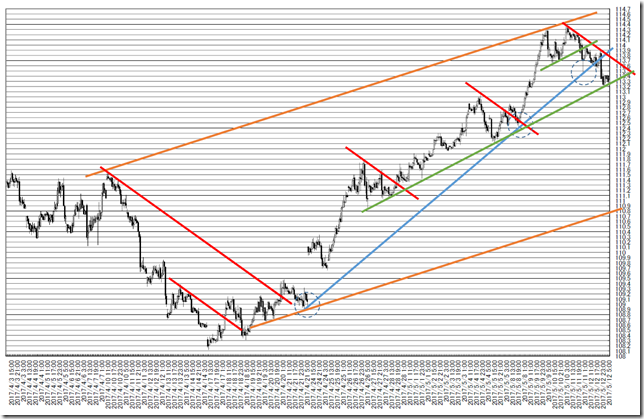
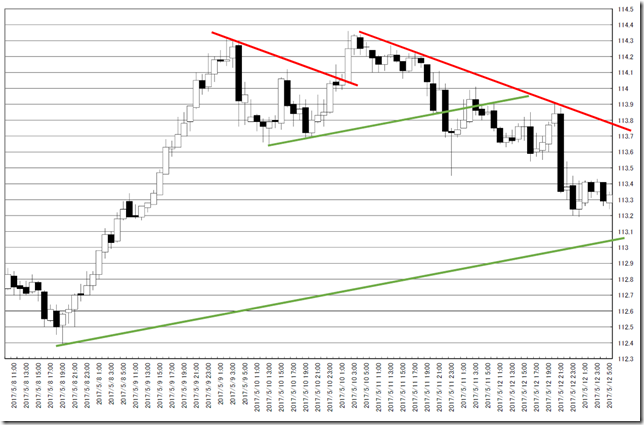
1時間足を使用しオセアニア時間帯を省いています。

引き続き、巨大な窓を残してオープンしています。

合言葉は「窓は埋まる」です。

とは言っても時間はかかると思います。

2017/5/8に紹介した青のサポートを切ったため、弱気入りの可能性が生まれています。

赤のラインを超えてくるようなら、見通し変更です。

緑をこえてくると(113円割れ)下方向への芽が一層でてくるとみています。

We used hourly data and the Oceania time zone market price is pulled out.

In this week, this market still remained a big gap.

We know the principal “Gap will bury”.

But it will take a long time.

We introduced Blue line in 5/8/2017 and this may be the signal of bear trend.

If the price will cut the red line, we need to change our view.

Cutting green line (cutting 113yen) will start a new bear trend.

chart1chart2


相場分析のリクエストがありましたら“Contact Us”からお知らせください。ご要望にお応えできるように努力いたします。

このブログはあくまでも個人的な見解であり、投資判断は各自でお願い致します。当ブログは一切の投資損益に対する責任を負いません。

ホームページに来て下さってありがとうございます。明日もよろしくお願いいたします。

If you have some request to analyze, please write to “Contact Us”.

We do best effort for your request.

These are only personal opinions on this blog, and you need the investment judgment in each one. This blog doesn’t assume the responsibility to all the investment profit and loss.

Thank for watching our contents. My best regards next day.

如果您需要行情分析,请点击“Contact Us”联系我们。我们将尽力满足您的要求。

本博客仅为个人意见,请各自做出投资判断。本博客概不对任何投资盈亏负责。

感谢您访问本博客。欢迎再次使用。

© 2025 Retar