日経平均とTOPIX関連性・過去をなぞるならTOPIXの1613.18pointはレジスタンスになるかも
Relation between TOPIX and N225; following the past price movement, 1613.18point in TOPIX may work as resistance.
在日经225和东证综合指数之间的关系。如果现在的价和过去的价格一样的话,1613.18点中的点可能作为阻力。
本日はTOPIXについてです。
Today is about TOPIX.
『結論は「中長期では株欲しくないかも」と思えてきます。』(2017/6/8)と紹介していますが、一方でRallyになる可能性もあるため、心の準備だけはしておきたいとおもいます。
We introduced “Our conclusion is we do not want to take long position from mid-to-long term view” (6/8/2017) but Japanese market may become a big rally and we need to prepare for it.
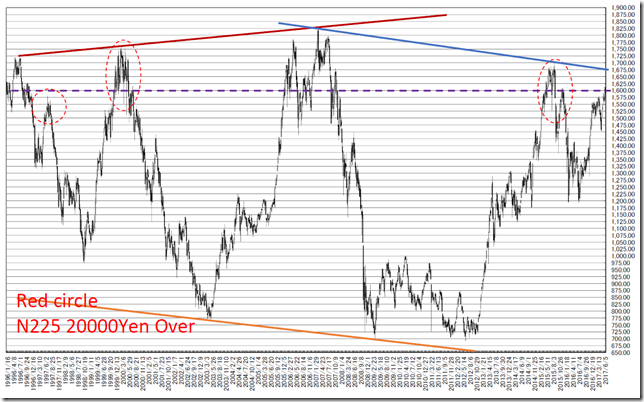
1997年以降、日経平均の20000円超えの局面は1997年、2000年、2015年と今回の局面がありました。
1997年以降の日経平均は21000円手前にガラスの天井が発生していることがわかります。
同時期のTOPIXと比較するとTOPIXには天井らしきものはありません。
興味深いのは、未だにTOPIXは2007年高値を未だ抜いていない点です。
言い換えるなら現在の状態は日経平均だけのRallyにみえます。
After 1997, in N225 market, 20000yen over phase were 4 times including the latest occasion.
We can see glass ceiling at 21000yen around in this market.
Comparing N225, there are no ceiling in TOPIX market.
Notable point is TOPIX market does not take new high after 2007.
In other word, the only rally market is N225.
“萎え萎え派”ですが、上昇基調に乗るためのシグナルを調査しました。
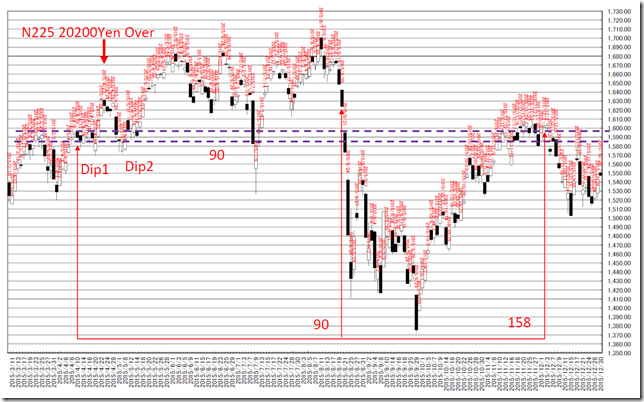
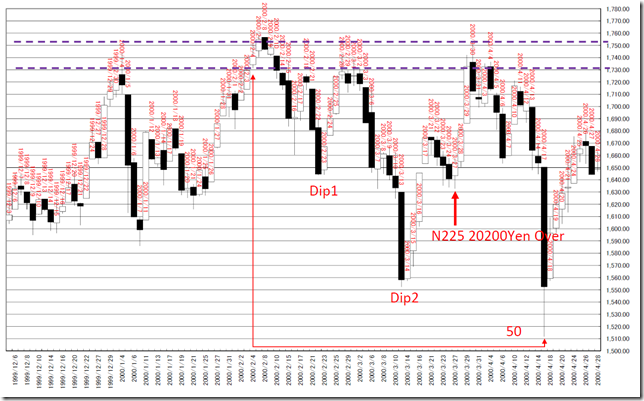
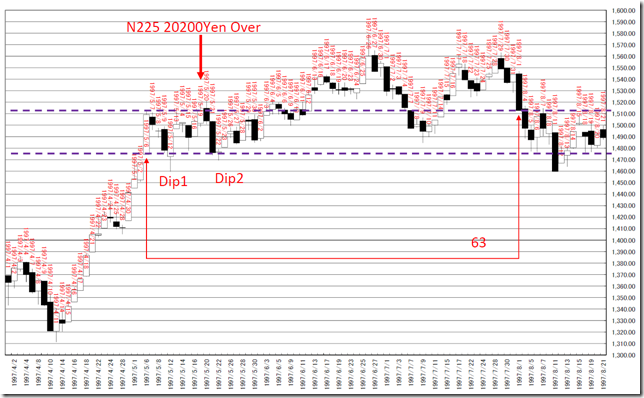
鍵となるのは日経平均が20000円を超えた初日のTOPIXの高値と安値です。
TOPIXのチャートに日経平均が20000円を超えた初日の高値と安値に横線を入れています。
1997年、2015年の場合、日経平均が一旦、20200円を超えた地点で、TOPIXの終値が20000円超え初日の高値を超えてきています。
その後、押しを形成した地点で20000円超え初日の安値を下回った地点が、良い買い場となっていました。
2000年の場合は、20000円超え初日の高値がレジスタンスとして機能しており、相場の天井感を演出していました。
We are bearish but we prepare for the start of next rally signal.
The key point is the TOPIX high and low price when N225 took 20000yen over.
Under these are TOPIX chart and we line the highest and lowest price when N225 took 20000yen over.
In 1997 and 2015 cases, after taking 20200yen over, TOPIX close price went up to the “Highest” of the first day.
After that, TOPIX went down the “Lowest” of the first day and that was great opportunity.
In 2000 case, the “Highest” of the first day worked as the resistance and this occasion implied “Peaked Out”.
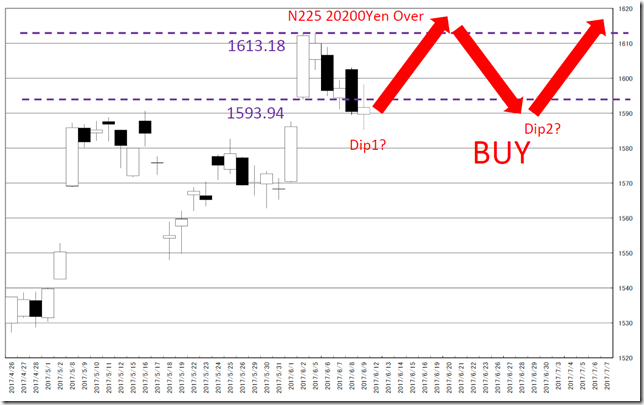
2017年の現在の相場に当てはめると、2017/6/2に日経平均は20000円を超えました。
2017/6/2のTOPIXの高値は1613.18ポイント、安値は1593.94ポイントでした。
もし、日経平均が20200円を超え、かつ、TOPIXが1613.18ポイントを超えた新高値の終値をとれば、再上昇の可能性が高まります。
しかし、日経平均が伸びていっても、TOPIXの1613.18ポイントがレジスタンスとなるようなら、天井感満点となるはずです。
Applying this to the latest case, the N225 first day taking 20000yen over was 6/2/2017.
In 6/2/2017, the highest was 1613.18point and the lowest was 1593.94point in TOPIX market.
If N225 will go 20200yen over and TOPIX will go 1613.18point over at the same time in close price, this will be the signal of next rally.
But N225 rally will continue and 1613.18point around in TOPIX will work as resistance, this will suggest “Peaked Out”.
相場分析のリクエストがありましたら“Contact Us”からお知らせください。ご要望にお応えできるように努力いたします。
このブログはあくまでも個人的な見解であり、投資判断は各自でお願い致します。当ブログは一切の投資損益に対する責任を負いません。
ホームページに来て下さってありがとうございます。明日もよろしくお願いいたします。
If you have some request to analyze, please write to “Contact Us”.
We do best effort for your request.
These are only personal opinions on this blog, and you need the investment judgment in each one. This blog doesn’t assume the responsibility to all the investment profit and loss.
Thank for watching our contents. My best regards next day.
如果您需要行情分析,请点击“Contact Us”联系我们。我们将尽力满足您的要求。
本博客仅为个人意见,请各自做出投资判断。本博客概不对任何投资盈亏负责。
感谢您访问本博客。欢迎再次使用。

