2017/06

日経平均・過去をなぞるなら20000円超の値もちはどんなに長くても今年10月末まで?・20200円を超えたらとりあえずLong/ N225 historically; keeping 20000yen over may be end of October at longest; 20200yen over will be buying opportunity. /日经225。保持20000日元可能是10月底最长的。20200日元将会买的机会。

2017/06/08

日経平均・過去をなぞるなら20000円超の値もちはどんなに長くても今年10月末まで?・20200円を超えたらとりあえずLong

N225 historically; keeping 20000yen over may be end of October at longest; 20200yen over will be buying opportunity.

日经225。保持20000日元可能是10月底最长的。20200日元将会买的机会。


本日は日経平均についてです。

過去20000円超えとなった局面について見ていきます。

結論は「中長期では株欲しくないかも」と思えてきます。

Today is about N225.

We surveyed past 20000yen over points.

Our conclusion is we do not want to take long position from mid-to-long term view.


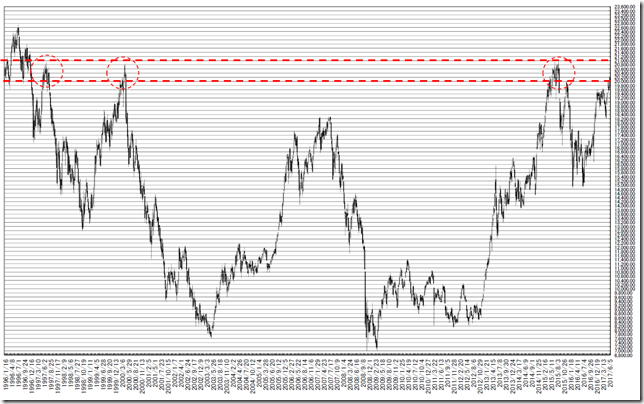
1997年以降、20000円超えの局面は1997年、2000年、2015年と今回の局面がありました。

1997年以降は21000円手前にガラスの天井が発生していることがわかります。

21000円を超えていくのは、難しいことが容易に想像できます。

After 1997, 20000yen over phase were 4 times including the latest occasion.

We can see glass ceiling at 21000yen around.

And this means 21000yen over will have many difficulty.

chart1


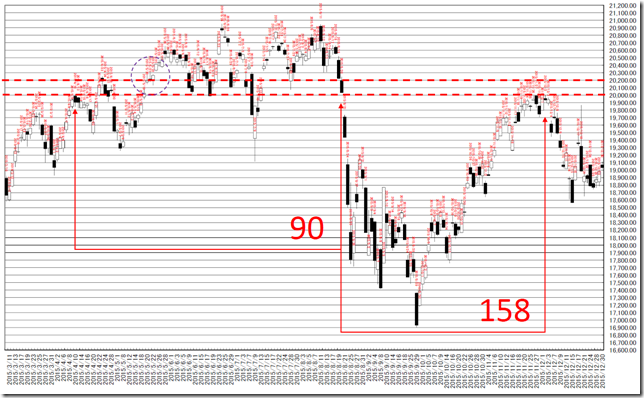
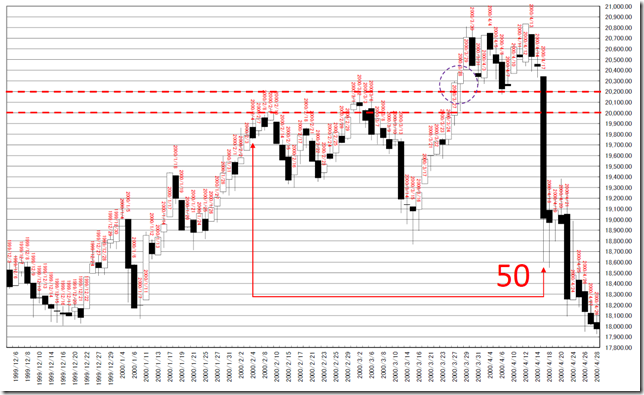
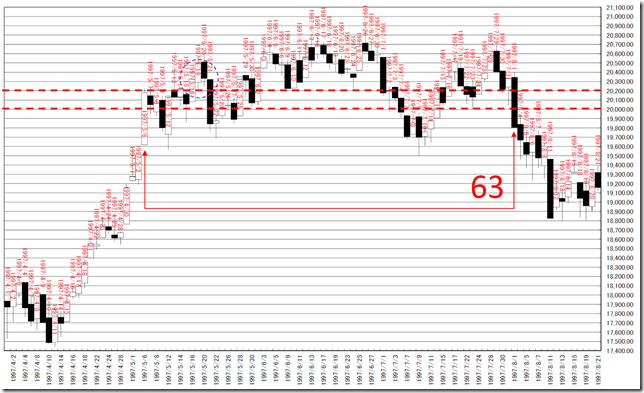
それぞれの年での20000円を超えてからの日足です。

最初に20000円超えてから、20000円超から本格的に下離れるまでの日数を調べると、おおよそ100営業日のチャートに収まることがわかります。

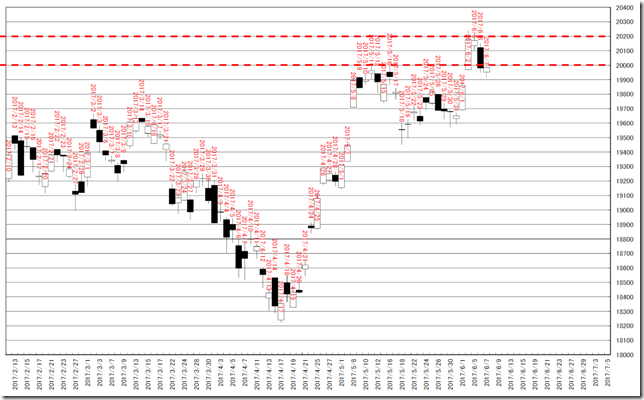
今回の相場では、最初に20000円超となったのは2017/6/2。

今回の相場に当てはめると、50営業日値もちすると8月中旬、100営業日値もちすると10月末ぐらいまでに下離れするとみえます。

These are each year of the chart cutting over 20000yen.

We can know relating 20000yen over was less than 100 business days; we can plot only 100 bar chart!

In the latest market, the first day cutting over 20000yen was 6/2/2017.

Applying this to the latest market, 50 business days is mid-August and 100 business days is at the end of October and the price will start falling until then.


もう一点の注目点は終値20200円を超えた地点の値動きです。

最初に終値20200円を超える地点では、ひとまず上方向への芽がでることがわかっています。

The other notable point is cutting 20200 yen in close price.

The first point cutting 20200 yen in close price, rally was started and this was a chance.


2015年は少し特殊です。

12月に2営業日だけ20000円超えがありました。

2015 was irregular pattern.

There were 2 business days cutting over 20000 yen in December.

chart2chart3chart4chart5


相場分析のリクエストがありましたら“Contact Us”からお知らせください。ご要望にお応えできるように努力いたします。

このブログはあくまでも個人的な見解であり、投資判断は各自でお願い致します。当ブログは一切の投資損益に対する責任を負いません。

ホームページに来て下さってありがとうございます。明日もよろしくお願いいたします。

If you have some request to analyze, please write to “Contact Us”.

We do best effort for your request.

These are only personal opinions on this blog, and you need the investment judgment in each one. This blog doesn’t assume the responsibility to all the investment profit and loss.

Thank for watching our contents. My best regards next day.

如果您需要行情分析,请点击“Contact Us”联系我们。我们将尽力满足您的要求。

本博客仅为个人意见,请各自做出投资判断。本博客概不对任何投资盈亏负责。

感谢您访问本博客。欢迎再次使用。


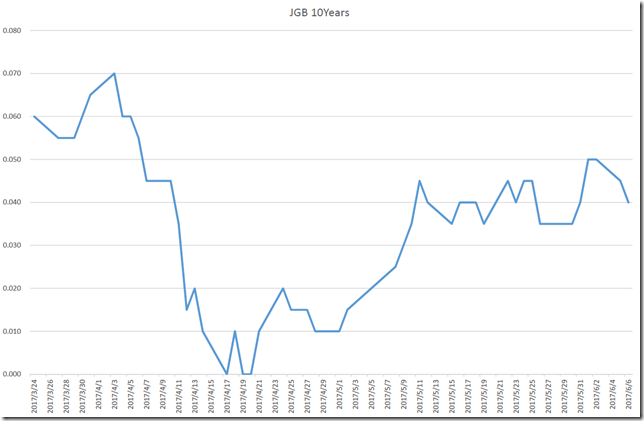
日本10年債利回り日足P&F・感慨深い!サポートもレジスタンスもプラス圏・サポート0.02、0.0ポイント、レジスタンス0.06ポイント/JGB 10-Year P&F Daily; Supports and resistances are above Zero; support is 0.02 and 0.0point and resistance is 0.06 point. /日本10年国债收益率。P&F分析。支持和抵抗高于零。 支持是0.02和0.0点。电阻是0.06点。

2017/06/07

日本10年債利回り日足P&F・感慨深い!サポートもレジスタンスもプラス圏・サポート0.02、0.0ポイント、レジスタンス0.06ポイント

JGB 10-Year P&F Daily; Supports and resistances are above Zero; support is 0.02 and 0.0point and resistance is 0.06 point.

日本10年国债收益率。P&F分析。支持和抵抗高于零。 支持是0.02和0.0点。电阻是0.06点。


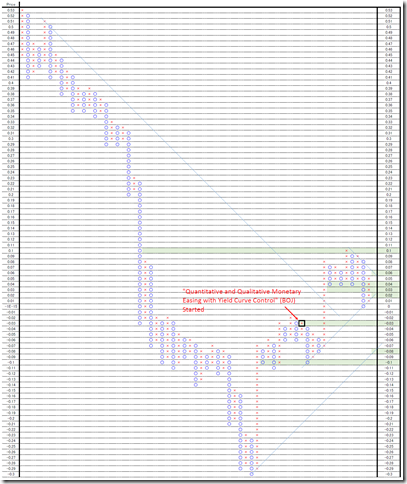
日銀の「長短金利操作付き量的・質的金融緩和」の新しい枠組みは、2016/09/21から実施されています。

言い換えると「鉄板天底付インフレにナレナレ相場操縦」。

相場は自然の摂理。大金持ちの相場操縦であっても、最後はマーケットに勝てないはずです。

"Quantitative and Qualitative Monetary Easing with Yield Curve Control" (BOJ) was started in 09/21/2016.

In other words, this is “Iron plated Market manipulation for inflation”.

Market is the law of nature and manipulator will never win.


「レジスタンスもサポートもすべてマイナスという不思議なレポートを書いています。」(2016/6/29)

“All resistances and supports are below zero and this seems to be eccentric.” (6/29/2016)


「日本10年債利回り日足P&F・「ゼロ程度で推移」とは、0.1pointから-0.1point?・プラス圏でも「ゼロ程度」?」(2016/10/17)と報告しています。

つまらない相場を観測するのは、とても飽き飽きするものです。

しかし、カナリアが鳴きはじめました。

レジスタンスもサポートもすべてプラス圏だとみています。

We reported “Japanese Government Bonds 10-Year P&F Daily; The meaning of “Targeting Zero around” may be from 0.1 point to -0.1point; plus zone is also “Targeting Zero around”?” in 10/18/2016.

Observing dull market often becomes boring.

But canary is whispering.

Resistances and supports are all above zero.


5月中旬以降鉄板底の様相です。

狭いレンジに押し込められているため、レジスタンスとサポートを絞り込む必要があるとみています。

After mid-May, this market is running in narrow range.

And we need to narrow range.

chart


1枠0.01ポイント、3枠転換の終値ポイントアンドフィギュアです。

サポート0.02、0.0ポイント、レジスタンス0.06ポイント。

P&Fでは、変化はありませんが、静かな胎動に注意を要する局面だとみています。

This is 0.01 price change and 3 box reversal close price’s Point and Figure chart.

Support is 0.02 and 0.0point and resistance is 0.06 point.

This chart has no change but we need to watch this small whispering.

PF


相場分析のリクエストがありましたら“Contact Us”からお知らせください。ご要望にお応えできるように努力いたします。

このブログはあくまでも個人的な見解であり、投資判断は各自でお願い致します。当ブログは一切の投資損益に対する責任を負いません。

ホームページに来て下さってありがとうございます。明日もよろしくお願いいたします。

If you have some request to analyze, please write to “Contact Us”.

We do best effort for your request.

These are only personal opinions on this blog, and you need the investment judgment in each one. This blog doesn’t assume the responsibility to all the investment profit and loss.

Thank for watching our contents. My best regards next day.

如果您需要行情分析,请点击“Contact Us”联系我们。我们将尽力满足您的要求。

本博客仅为个人意见,请各自做出投资判断。本博客概不对任何投资盈亏负责。

感谢您访问本博客。欢迎再次使用。

© 2025 Retar