2017/06

日経平均は拡大波動・今後の調整に注目したい局面・週足終値20200円超からは昇竜拳では?/N225 is “Y” wave and next collection will be watershed; 20200yen over will start a new rally. /日经225。日经225是“Y”波。注重未来的价格走势。20200日元将开始新的反弹。

2017/06/16

日経平均は拡大波動・今後の調整に注目したい局面・週足終値20200円超からは昇竜拳では?

N225 is “Y” wave and next collection will be watershed; 20200yen over will start a new rally.

日经225。日经225是“Y”波。注重未来的价格走势。20200日元将开始新的反弹。


チャートに残る状況証拠を積み重ねると、シナリオは想像できます。

本日は日経225の過去の拡大波動局面を考えてみました。

We gather evidences on the chart, we can make scenario in future.

Today, we analyze past “Y” wave circumstances.


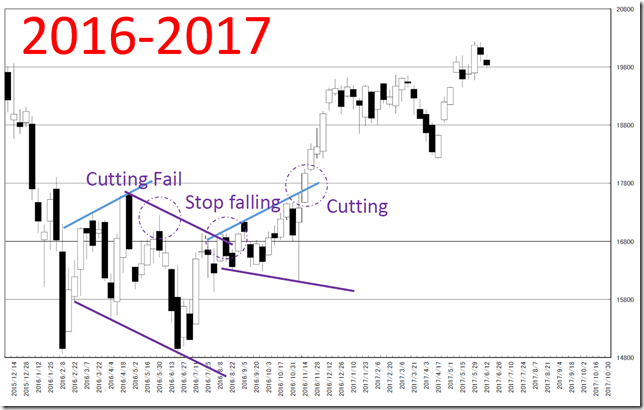
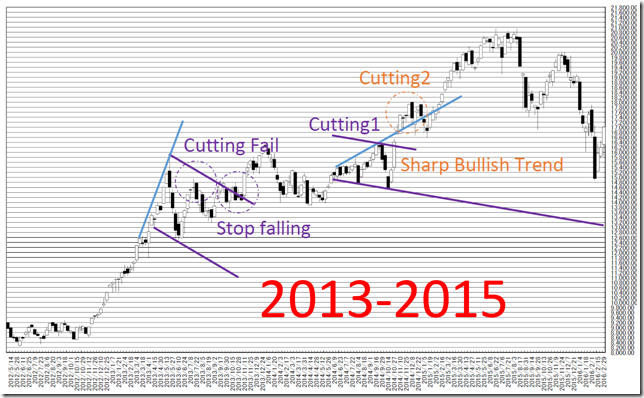
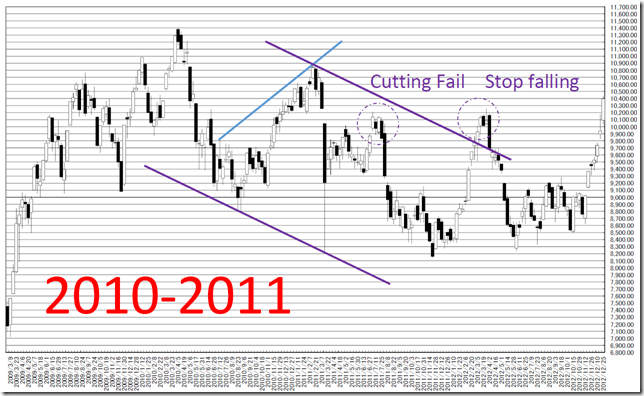
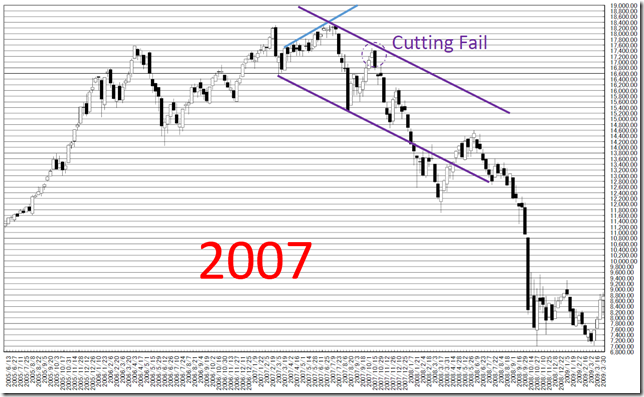
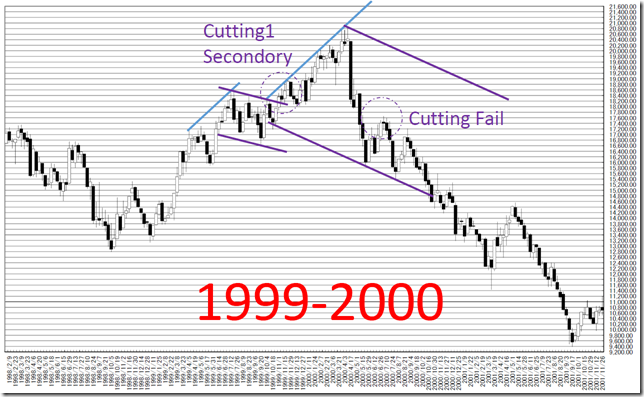
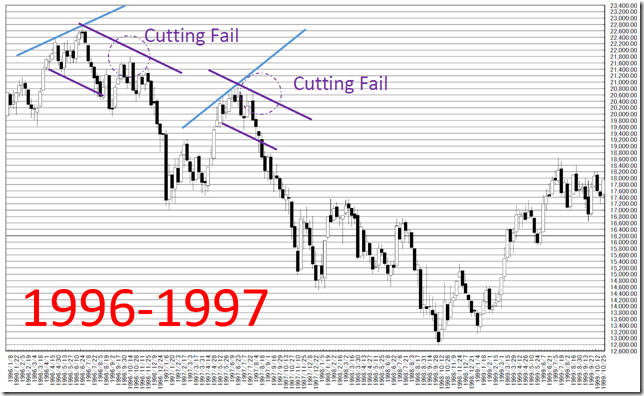
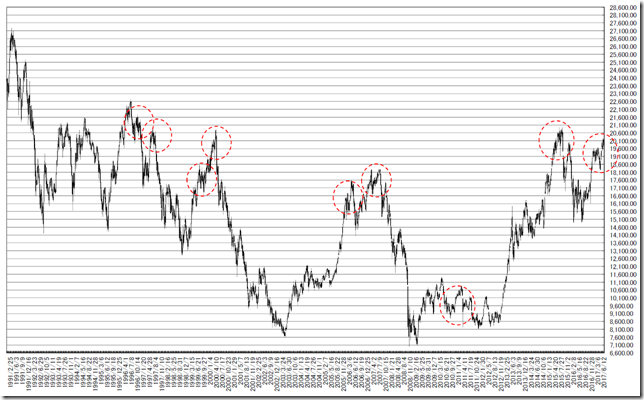
拡大波動の発生している局面を週足チャート上で調査しました。(目視だけなので他にもあると思います)

しばしば見かける型であり、週足の場合は、トレンドラインを使い均一の手法で臨めます。

We confirm “Y” wave points on weekly chart. (This analyze is only seeking on the chart and you can find others)

This is often appearing pattern and in weekly chart, we can use same method to follow the trend.

ALL


上がる場合では、1.頂点からの押しで紫の最外郭線をスルリと抜いていく場合、2.頂点からの押しで最外郭に届かずに下落して、しばらく後に最外郭付近を超え、下げ止まりを確認する2パターンに分かれます。

下落する場合は、1.最外郭サポートの紫を割り込む、2.最外郭レジスタンスの紫に届かずに新安値をつける場合があるようです。

In rally cases, there were two patterns; cutting purple line direct (No.1) and cannot reach purple line and fall and cutting after some time (No.2).

In falling cases, there were two patterns; cutting purple support line directly (No.1) and cannot reach outer purple line and taking new low.

123456


「日経平均・過去をなぞるなら20000円超の値もちはどんなに長くても今年10月末まで?・20200円を超えたらとりあえずLong」(2017/6/8)

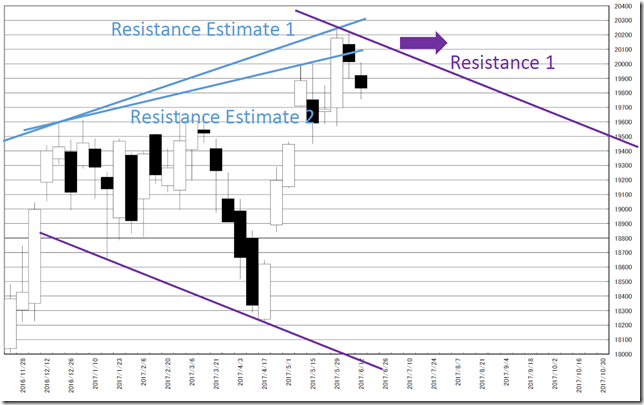
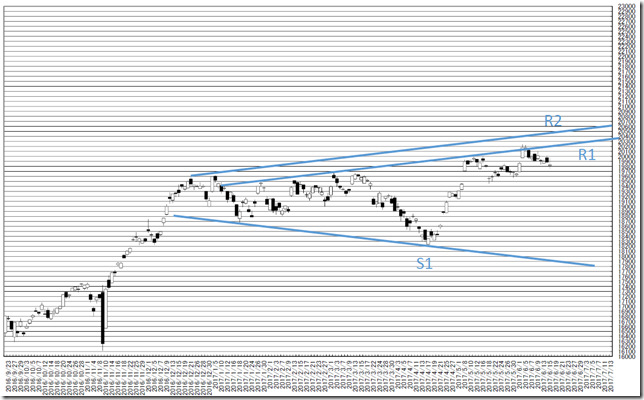
現在の相場に当てはめると、「Resistance Estimate 1」、「Resistance Estimate 2」の存在が確認できます。

すでに、高値に到達しているのか、新高値に向かっているただの押しなのか、今後はっきりします。

もしくは今後、20000円前後で「Resistance 1」が右側に移動する可能性もあります。

そうしたなかでも、どこかの時点で、週足終値20200円超えをつけることがあれば、最外郭を超え、再び新しい強気相場入りの確認になるとみています。

We reported “N225 historically; keeping 20000yen over may be end of October at longest; 20200yen over will be buying opportunity” in 6/8/2017.

Applying this fact to the latest market, we can confirm “Resistance Estimate 1” and “Resistance Estimate 2”.

We will know “Resistance Estimate 1” or “Resistance Estimate 2” will be the true line in future.

Or “Resistance 1” may over to right side.

In any way, cutting 20200 yen over will mean a start of new rally.

7


相場分析のリクエストがありましたら“Contact Us”からお知らせください。ご要望にお応えできるように努力いたします。

このブログはあくまでも個人的な見解であり、投資判断は各自でお願い致します。当ブログは一切の投資損益に対する責任を負いません。

ホームページに来て下さってありがとうございます。明日もよろしくお願いいたします。

If you have some request to analyze, please write to “Contact Us”.

We do best effort for your request.

These are only personal opinions on this blog, and you need the investment judgment in each one. This blog doesn’t assume the responsibility to all the investment profit and loss.

Thank for watching our contents. My best regards next day.

如果您需要行情分析,请点击“Contact Us”联系我们。我们将尽力满足您的要求。

本博客仅为个人意见,请各自做出投资判断。本博客概不对任何投资盈亏负责。

感谢您访问本博客。欢迎再次使用。


日経平均日足・夏至の頃の変化時間帯に注目/NIKKEI 225 daily; We need to watch summer solstice around as “HENKABI” zone. /日经225。我们注意将夏至的“变化日”区域。

2017/06/15

日経平均日足・夏至の頃の変化時間帯に注目

NIKKEI 225 daily; We need to watch summer solstice around as “HENKABI” zone.

日经225。我们注意将夏至的“变化日”区域。


本日は日経225超短期日足についてです。

結論は「夏至の頃の変化日に注目」。

しかしながら、Y波動の収束までは、落ち着いてみられない相場。

R2チャレンジも視野にいれておきたいと思います。

Today is about N225 daily.

Our conclusion is ‘We need to watch summer solstice around as “HENKABI” zone’.

But we need to wait for the end of “Y” wave to grasp the true figure of this market.

The price may challenge “R2” resistance.

chart0


日柄のレポートは復習つきで解説していきます。

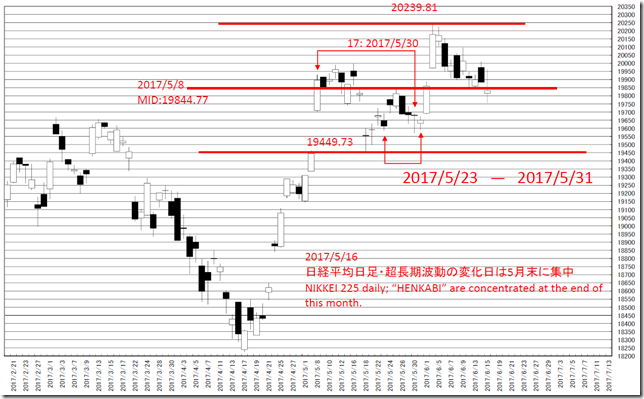
「日経平均日足・超長期波動の変化日は5月末に集中」(2017/5/16)

20000円オーバーに突然向かった時期をとらえていました。

We review our past “HIGARA” report in any time.

We reported ‘NIKKEI 225 daily; “HENKABI” are concentrated at the end of this month’ in 5/16/2017.

We captured sharp reversal point to 20000yen over.

chart1


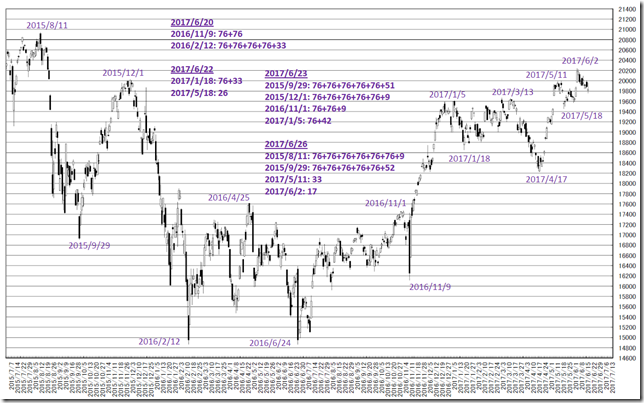
メジャーな頂点からの変化日の位置です。

注目は2016/11/9からの76+76手を迎える地点を2017/6/20に迎えます。

2016/11/9からの76手は2017/3/1。

その付近から上下に包んだ相場でした。

次の76手もワイルドな時間を目指すとはみています。

NIKKEI 225 annual No.6; The formation of candle stick from January to April; Bearish trend will come after summer.

This is the “HENKABI” from the major peaks.

6/20/2017 is 76+76 business days from 11/9/2016 and this day will be notable point.

3/1/2017 is 76 business days from 11/9/2016.

And wild price movement started at that time around.

We think the next 76 price movement will also wild!

chart2


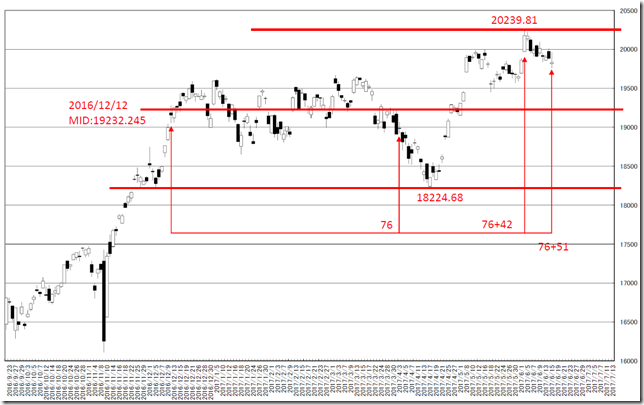
2016/12/12を基点とした持ち合いです。

現在は76+51手、76+52手での反転になるか注目の地点です。

直近の頂点の2017/6/2からの9手で反転していないため、下がりだすとズリズリ行く可能性を秘めます。

This is steadiness from 12/12/2016.

The latest condition is 76+51 and 76+52 business days and may reverse.

And the price does not reverse at 9 business days from the major peak; if bear trend will continue, falling will continue more.

chart3


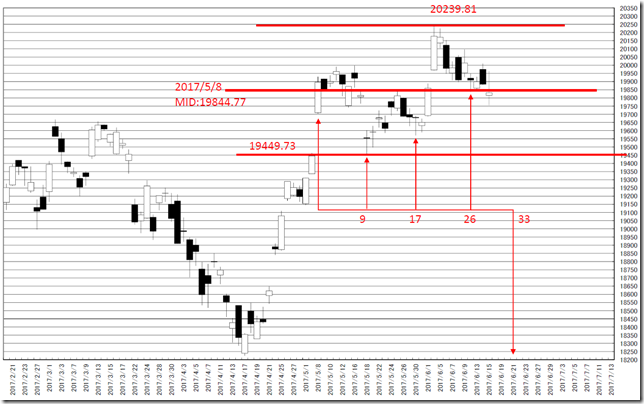
2017/5/8を基点とした持ち合いです。

26手をこえて下落しているため、弱気示唆です。

次の変化日の2017/6/21付近の値動きに注目したいと思います。

This is steadiness from 5/8/2016.

The price felled 26 business days over and this may imply bearish trend.

The next “HENKABI” is 6/21/2017 and we need to watch.

chart4


相場分析のリクエストがありましたら“Contact Us”からお知らせください。ご要望にお応えできるように努力いたします。

このブログはあくまでも個人的な見解であり、投資判断は各自でお願い致します。当ブログは一切の投資損益に対する責任を負いません。

ホームページに来て下さってありがとうございます。明日もよろしくお願いいたします。

If you have some request to analyze, please write to “Contact Us”.

We do best effort for your request.

These are only personal opinions on this blog, and you need the investment judgment in each one. This blog doesn’t assume the responsibility to all the investment profit and loss.

Thank for watching our contents. My best regards next day.

如果您需要行情分析,请点击“Contact Us”联系我们。我们将尽力满足您的要求。

本博客仅为个人意见,请各自做出投资判断。本博客概不对任何投资盈亏负责。

感谢您访问本博客。欢迎再次使用。

© 2025 Retar