2018/05

米ダウ工業株月足100年(2)・日柄的な本当の意味での爆下げは1929年と2000年?

2018/05/10

米ダウ工業株月足100年(2)・日柄的な本当の意味での爆下げは1929年と2000年?

Dow Jones Industrial Average (^DJI) Monthly; using 100years data(2); From “HIGARA” view, true falling was only 1929 and 2000.

美国道琼斯工业平均指数。100年的分析(2)。从“日柄”的说法,真正的下跌就是1929年和2000年。


結論は、本物下げは1929年と2000年だけ、1987年、2007年は押し?

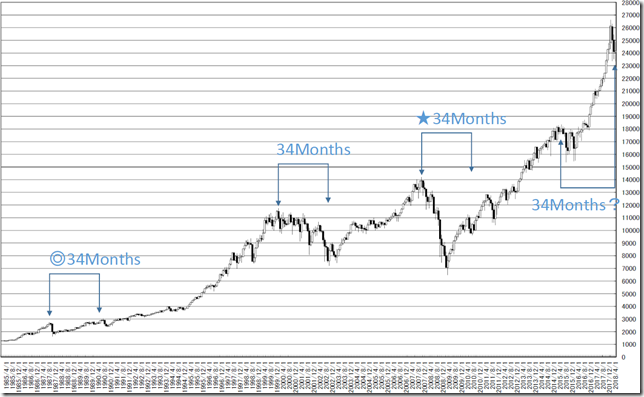
2018/04は2015/07からの34ヶ月、2020/09は2018/01もまた34ヶ月、さてどうなるか?

Out conclusion is true collapse were 1929 and 2000 and 1987 and 2007 were only dip.

04/2018 was 34 months from 07/2015 and 09/2020 will also 34 months from 01/2018.

What will happen in this market?


「米ダウ工業株月足100年(1)・今となっては1929やリーマンショックは“ショボイ”下げに感じる・2016年以降の上げは爆騰感満点」(2018/5/9)

We reported “Dow Jones Industrial Average (^DJI) Monthly; using 100years data(1); we fell falling in 1929 and Lehman shock were trivial fall and after 2016 is great rally” in 5/9/2018.


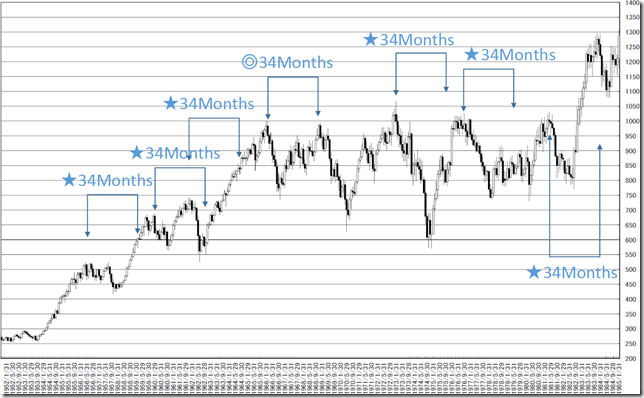
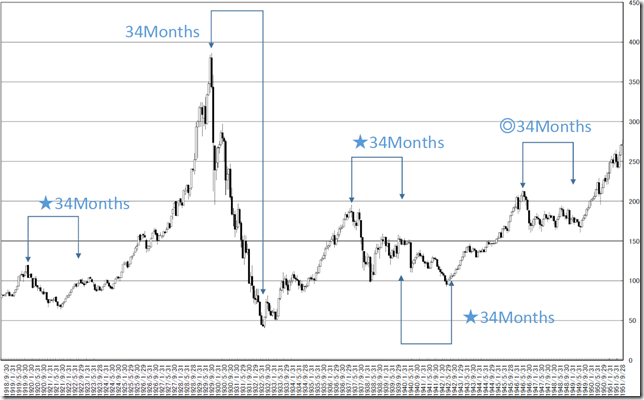
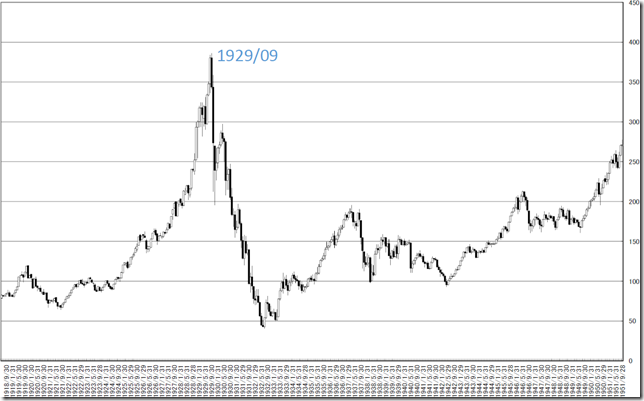
1929と2000年ピークは、34ヶ月で底をつけました。

それ以外はそれ以前にボトムアウトしていたようです。(星の地点)

また、34ヶ月周期から、更に下がるパターンもありましたが、その場合は、大きな下落とはなっていませんでした。(二重丸)

1987年も2007年の下げも34ヶ月を前にボトムアウトしたタイプでした。

The bottom was taken in 34months in 1929 and 2000.

Other points, the major bottom was take before 34 months. (Starts)

And the price took lower from 34 months over but it was just little. (Double circle)

In 1987 and 2007 pattern, the price took the bottom before 34 months.


2018/01の高値がメジャーピークだと仮定すると、今後起こるべきシナリオは2つ。

2020/09に大底をつけるか、2020/09を前に大底をつけるかです。

後者の場合ならば、その後の底は浅いとみています。

If 01/2018 were the major peak, we can estimate two scenarios.

9/2020 will be the major bottom or bottom out.

If the later scenario will come true, the lower after that will be a little one.

chart1_convchart2_convchart3_conv


★★レポート作成時データのダウンロード★★

ブログで使用したデータをダウンロードしていただけます。

内容により非提供の場合があります。


相場分析のリクエストがありましたら“Contact Us”からお知らせください。ご要望にお応えできるように努力いたします。

このブログはあくまでも個人的な見解であり、投資判断は各自でお願い致します。当ブログは一切の投資損益に対する責任を負いません。

ブログに来て下さってありがとうございます。明日もよろしくお願いいたします。

If you have some request to analyze, please write to “Contact Us”.

We do best effort for your request.

These are only personal opinions on this blog, and you need the investment judgment in each one. This blog doesn’t assume the responsibility to all the investment profit and loss.

Thank for watching our contents. My best regards next day.

如果您需要行情分析,请点击“Contact Us”联系我们。我们将尽力满足您的要求。

本博客仅为个人意见,请各自做出投资判断。本博客概不对任何投资盈亏负责。

感谢您访问本博客。欢迎再次使用。


米ダウ工業株月足100年(1)・今となっては1929やリーマンショックは“ショボイ”下げに感じる・2016年以降の上げは爆騰感満点

2018/05/09

米ダウ工業株月足100年(1)・今となっては1929やリーマンショックは“ショボイ”下げに感じる・2016年以降の上げは爆騰感満点

Dow Jones Industrial Average (^DJI) Monthly; using 100years data(1); we fell falling in 1929 and Lehman shock were trivial fall and after 2016 is great rally.

美国道琼斯工业平均指数。100年的分析(1)。回想起来1929年下跌和雷曼震荡则微不足道。在2016年之后是伟大的反弹,然后会发生什么?


本日は米ダウ工業株月足についてです。

結論は100年分のデータを観察するには3等分するのがおすすめです。

Today’s analyze is Dow Jones Industrial Average (^DJI) Monthly.

Our conclusion is when we analyze 100years, we should divide in 3 charts.


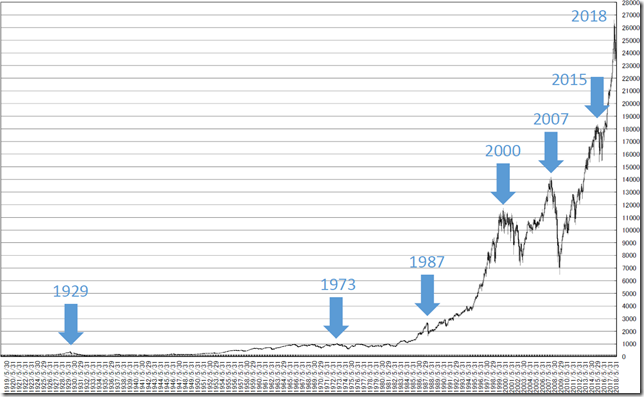
100年分(1200ヶ月)のチャートを書いてみました。

改めてみると、過去のピークというのは時と共にショボくなっていったことがわかります。

例えば、1929の下げは今となっては、ちょっとしたコブ程度です。

1970年代はモンデいた時代、値動きがあったのは1980年代以降にみえてしまいます。

This is 100years chart. (1200months)

We can know past peaks were trivial peaks.

For example, 1929 was a small bump.

And 1970’s was steadiness zone and the price was moved only after 1980.

chart1_conv


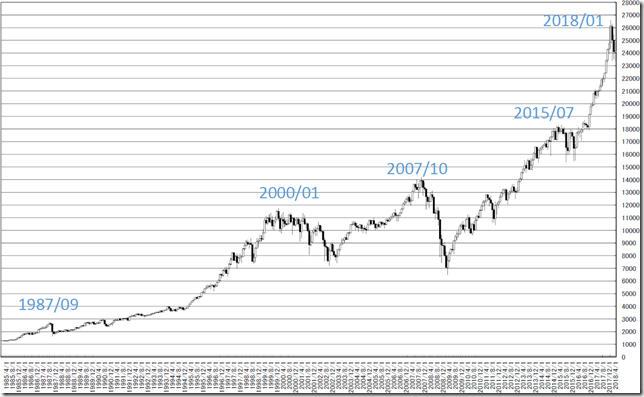
400ヶ月ごとに分割しました。

1929の上げも下げも、ヤバい下げだった点が理解できます。

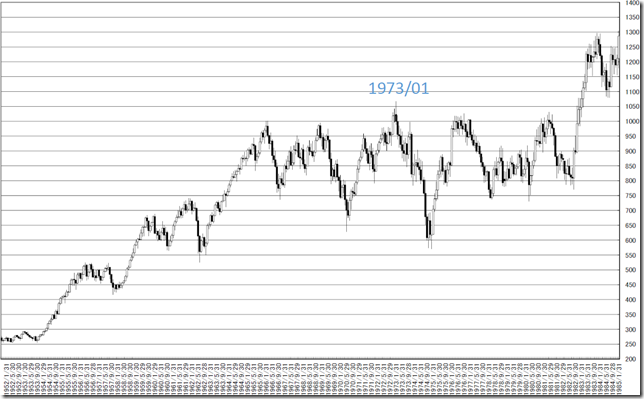
1970年代はもみ合いとは言っても高値からの半値となっていました。

最近の下げとしては1987、2000、2007、2015年などがありますが、今となってはカワ(・∀・)イイ!!下げに見えてきます。

もちろん、最近の上げも大したものです。

These are 400 month’s chart.

We can know 1929 was great sharp up and down.

In 1970’s, the price got the half price from the highest.

The latest fall were trivial such as 1987, 2000, 2007 and 2015.

Of course, the latest rally is big one.

chart2_convchart3_convchart4_conv


★★レポート作成時データのダウンロード★★

ブログで使用したデータをダウンロードしていただけます。

内容により非提供の場合があります。


相場分析のリクエストがありましたら“Contact Us”からお知らせください。ご要望にお応えできるように努力いたします。

このブログはあくまでも個人的な見解であり、投資判断は各自でお願い致します。当ブログは一切の投資損益に対する責任を負いません。

ブログに来て下さってありがとうございます。明日もよろしくお願いいたします。

If you have some request to analyze, please write to “Contact Us”.

We do best effort for your request.

These are only personal opinions on this blog, and you need the investment judgment in each one. This blog doesn’t assume the responsibility to all the investment profit and loss.

Thank for watching our contents. My best regards next day.

如果您需要行情分析,请点击“Contact Us”联系我们。我们将尽力满足您的要求。

本博客仅为个人意见,请各自做出投资判断。本博客概不对任何投资盈亏负责。

感谢您访问本博客。欢迎再次使用。

© 2025 Retar