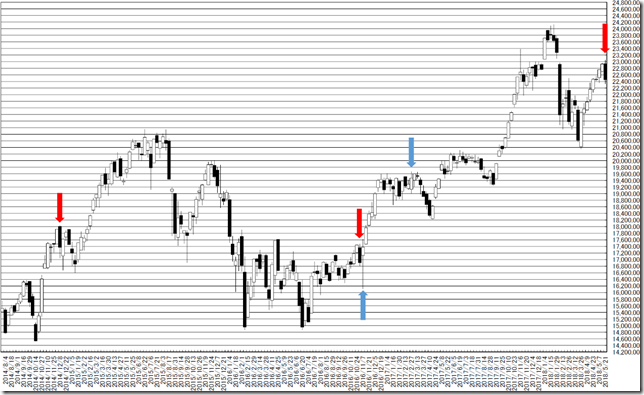
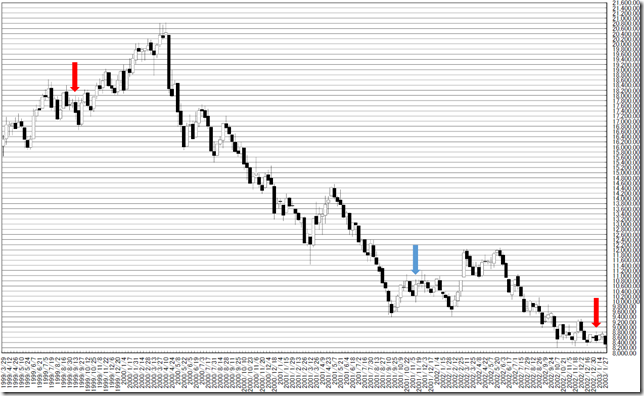
日経平均週足・羽黒16(10)号線・再び22500円より下なので弱気・2007年の大天井も2手包みだったことも思い出したい
NIKKEI 225 weekly is “HAGURO” No. 16(10) formation; the price get lower than 22500yen and now is bearish; the major peak in 2007 was also “Engulfing bar”.
日经225。羽黑16(10)号线。价格低于22,500日元,因此现在看跌。2007年的主要高峰期也是“穿頭破腳”。
結論は、22500円を下回ったため弱気。
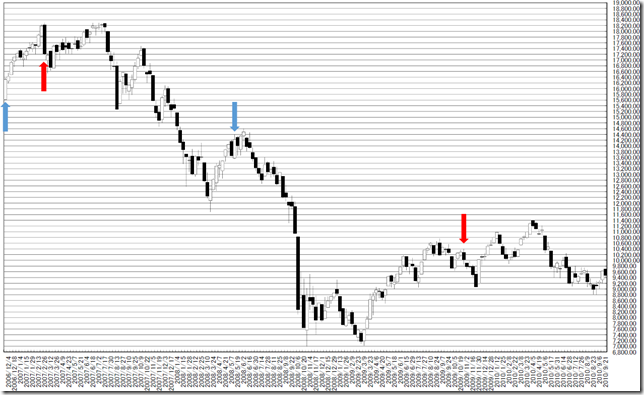
2007年の大天井も包みでオワッタ点も思い起こしたい。
Our conclusion is the price gets lower than 22500yen and now is bearish.
We need to remind the major peak in 2007 was also ended by “Engulfing bar”.
日経平均週足・羽黒16(10)号線・引き続き週足クローズで22500円を超えなければ強気になれず、21000円割れならベアマーケット入り(2018/3/16)
日経平均週足・羽黒8号線・最近流行りの底打ちの型だが、本格戻りは22502.05円超えから(2018/3/30)
日経平均週足・羽黒2号線・レンジ上限一杯、更に上がるなら次の節は22500円(2018/4/21)
日経平均週足・羽黒4号線・レンジ一杯上限・一段高なら23000円を目指す型だが、ダブルトップ含み(2018/4/28)
日経平均週足・羽黒4号線・上値は限られているとみるが、23000円試しへの強気で臨みたい・サポートは22500円(2018/5/12)
NIKKEI 225 weekly is “HAGURO” No.2 formation; the price reached upper side limit; Rally will continue more, next resistance point will be 22500yen.(4/21/2018)
NIKKEI 225 weekly is “HAGURO” No.4 formation; the price reached upper side limit; rally will continue, the price will reach 23000yen around but may become double top.(4/28/2018)
NIKKEI 225 weekly is “HAGURO” No.4 formation; bullish and the next target will be 23000yen around; support is 22500yen. (5/12/2018)
日経225週足線は羽黒16(10)号線となりました。
羽黒16号線単体では判定不能のため、判定は保留です。
そのかわりにもっと興味深い2手包みをだしました。
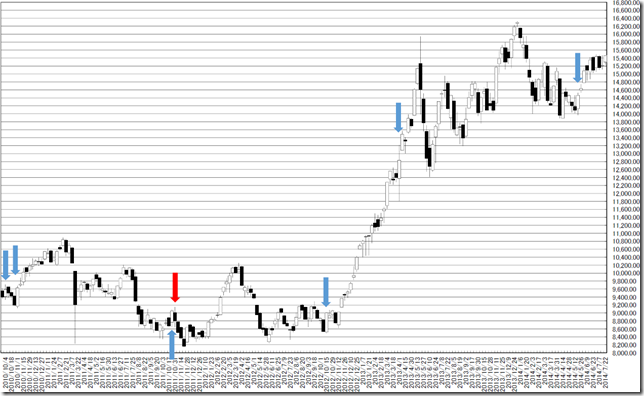
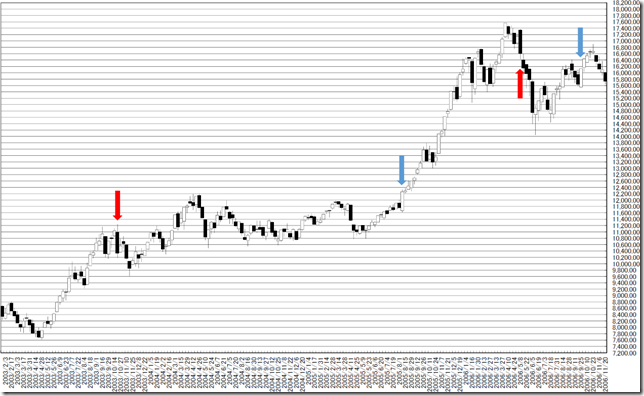
過去には上値が重くなる傾向がみてとれますが、実体抜きとなれば、強気相場継続となります。
もちろん、下方向にも警戒が必要です。
例えば、思い起こしたいのは2007年の天井です。
In this week, N225 formed “HAGURO” No. 16(10) formation.
We cannot judge from single “HAGURO” No. 16 formation.
The price formed two weeks “Engulfing bar”.
In past market, cutting with white candle stick body made start of rally.
Of course, we need to prepare for falling.
For example this formation became end of big rally in 2007.
ブログで使用したデータをダウンロードしていただけます。
内容により非提供の場合があります。
相場分析のリクエストがありましたら“Contact Us”からお知らせください。ご要望にお応えできるように努力いたします。
このブログはあくまでも個人的な見解であり、投資判断は各自でお願い致します。当ブログは一切の投資損益に対する責任を負いません。
ブログに来て下さってありがとうございます。明日もよろしくお願いいたします。
If you have some request to analyze, please write to “Contact Us”.
We do best effort for your request.
These are only personal opinions on this blog, and you need the investment judgment in each one. This blog doesn’t assume the responsibility to all the investment profit and loss.
Thank for watching our contents. My best regards next day.
如果您需要行情分析,请点击“Contact Us”联系我们。我们将尽力满足您的要求。
本博客仅为个人意见,请各自做出投资判断。本博客概不对任何投资盈亏负责。
感谢您访问本博客。欢迎再次使用。

