2018/06

日経平均週足・羽黒5号線・翌週に22694.5円を超えた引け値となれば更なる上昇期待だが、天井になることも・23000円まではありか

2018/06/08

日経平均週足・羽黒5号線・翌週に22694.5円を超えた引け値となれば更なる上昇期待だが、天井になることも・23000円まではありか

NIKKEI 225 weekly is “HAGURO” No.5 formation; if the close after next week will be 22694.5yen over, rally will continue but now may reach the major peak; the price may try 23000yen around

日经225。羽黑5号线。如果下周后收盘将超过22694.5日元,就反弹行情将持续。但现在可能会达到主峰了。价格可能试23000日元左右。


本日は日経225についてです。

結論は、22500円を超えており、さらに実体抜きをすれば強気。

23000円まではアリ。

「日経平均週足・羽黒16(10)号線・再び22500円より下なので弱気・2007年の大天井も2手包みだったことも思い出したい」(2018/5/25)

メインシナリオは、上げるにしてもガリット押してから。

Today is about N225.

Our conclusion is the price cut 22500 yen and may reach 23000yen and cutting 22694.5yen with candle stick body will be start of rally.

We reported “NIKKEI 225 weekly is “HAGURO” No. 16(10) formation; the price get lower than 22500yen and now is bearish; the major peak in 2007 was also “Engulfing bar”” in 5/25/2018.

Our main scenario is this market needs a dip.


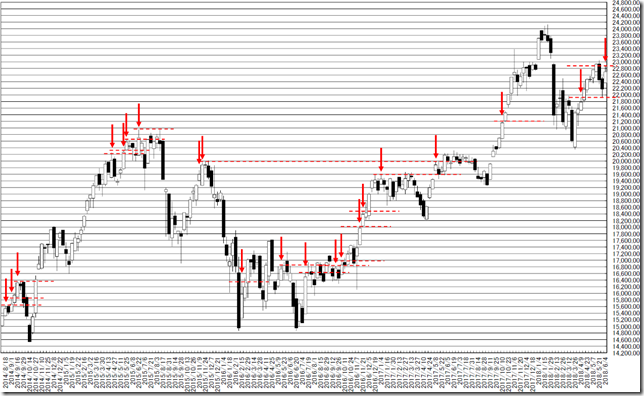
日経225週足線は羽黒5号線となりました。

日経225週足線では200週で羽黒5号線は22回出現しています。

過去には1.「天井示唆」、2.「翌週に終値を抜き、上げ継続」の2パターンがあります。

22500円を超えているため、23000円までは期待できます。

しかし、トットと逃げる用意をして臨むべき相場だとみています。

In this week, N225 formed “HAGURO” No. 5 formation.

In past 200 weeks, N225 price formed “HAGURO” No. 5 formation was 22 times.

There were two patterns in past occasions; 1:“Peaked Out” or 2:”Taking new high and keeping it at close in next week”.

The price may reach 23000yen.

But we need to prepare for escape this market.

chart1_conv


★★レポート作成時データのダウンロード★★

ブログで使用したデータをダウンロードしていただけます。

内容により非提供の場合があります。


相場分析のリクエストがありましたら“Contact Us”からお知らせください。ご要望にお応えできるように努力いたします。

このブログはあくまでも個人的な見解であり、投資判断は各自でお願い致します。当ブログは一切の投資損益に対する責任を負いません。

ブログに来て下さってありがとうございます。明日もよろしくお願いいたします。

If you have some request to analyze, please write to “Contact Us”.

We do best effort for your request.

These are only personal opinions on this blog, and you need the investment judgment in each one. This blog doesn’t assume the responsibility to all the investment profit and loss.

Thank for watching our contents. My best regards next day.

如果您需要行情分析,请点击“Contact Us”联系我们。我们将尽力满足您的要求。

本博客仅为个人意见,请各自做出投资判断。本博客概不对任何投资盈亏负责。

感谢您访问本博客。欢迎再次使用。


NY金日足トレンドライン・上げるときは1340ポイントで下がらないことを確認してから1400ポイントへのジャンプとなるのでは?・1200ポイント台前半は拾い場

2018/06/07

NY金日足トレンドライン・上げるときは1340ポイントで下がらないことを確認してから1400ポイントへのジャンプとなるのでは?・1200ポイント台前半は拾い場

NY GOLD Daily Trend Line; 1340point around will be watershed of the market and 1200point low will be buying point.

纽约黄金。趋势线分析。1340点左右将成为市场的分水岭,1200点的低点将成为买入点。


結論は、持ち合い相場は確定的。1200ポイント前半は拾い場では。

持ち合い相場を確認できるような動きであるため、この夏はサンキューだとみています。

Our conclusion is this is steadiness market and 1200 point low will be buying point.

Our main scenario is a big “Thank You” phase will come in this summer.


「NY Gold超長期・2018/4中旬に安値の時間帯・2019/4中旬に強力な変化時間帯」(2018/3/14)

2018/4/11に高値をつけ下落となったため、安値の時間帯は「ハズレ」でしたが、変化時間帯を捕らえたとは思っています。

「NY Gold超長期・「右手にマツタケ、左手に延べ棒」・秋は金買い場か?」(2016/5/19)

既に大底はとっており、せいぜい下げても100-150ポイント程度の話だとみています。

シナリオ崩れは新安値をつけることです。

We reported “NY Gold Long term; At Mid-April, this market will take lower and mid-April 2019 will be big “HENKABI”” in 3/14/2018.

The price took year high in 4/11/2018 and we are wrong but we captured “HENKABI” zone.

We reported “NY Gold Long term; Autumn will be a good opportunity to buy” in 5/19/2016.

Our main scenario is this market has already taken the major bottom.


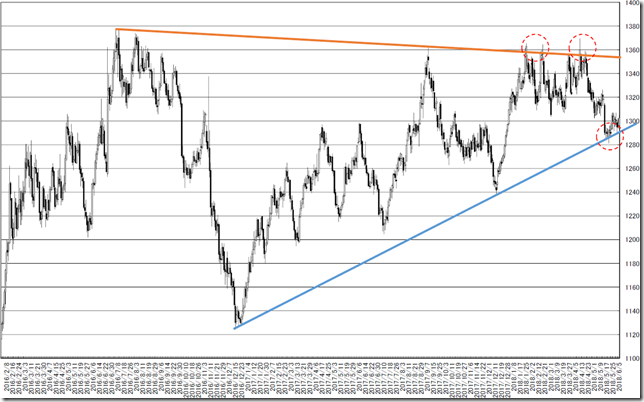
最外郭を両方とも割り込んでいるため、持ち合い相場は確定的です。

下方向への大きな崩れも想定しておくべき局面です。

「NY Gold超長期・「3月に安値をつけ、4、5月に高値圏、夏に押し、年末はラリー」は2000年代の値動きパターン・頭の片隅には1200ポイント前半までの下落も想定も必要」(2018/3/18)

夏なので安値である可能性が高く、仕込み時の可能性が生まれます。

The price cut each side of the lines and this occasion means now is steadiness.

And this will mean a big fall may come.

We reported “NY Gold Long term; Now is similar price movement in 2000s; but we need to remind this market may be a big collection” in 3/18/2018.

Now is summer season and may be buying chance.

chart1_conv


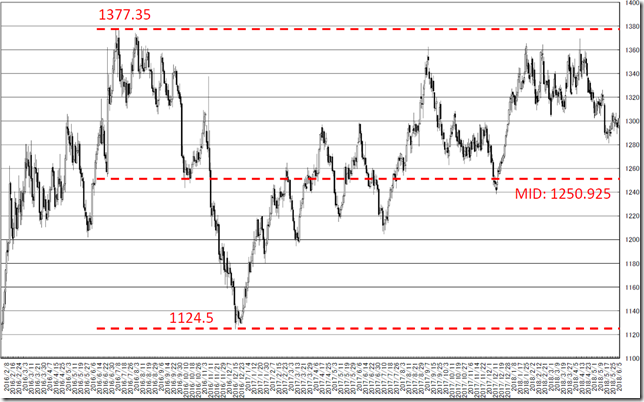
巨視的にみると約1年程度持ち合いです。

エネルギーは蓄積されており、今後の大崩や跳ねが想定されます。

しかしながら、短期的には持ち合いなので、1250ポイントを試すのは想定内です。

Now is “Inside Bar” and this is typical steadiness.

And the price is accreting the power and big move will come.

But taking 1250 point around will be natural.

chart2_conv


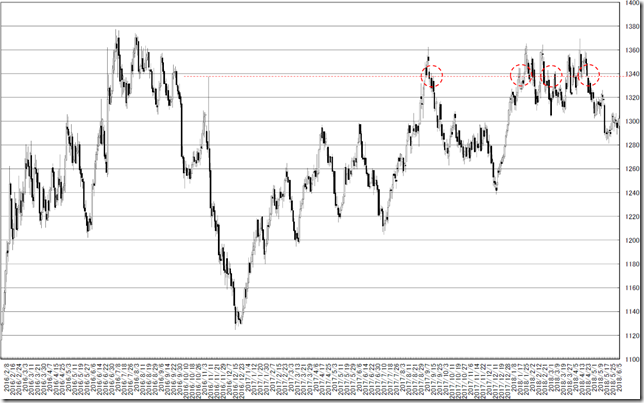
もう一つ気づいた点は、1340ドルはやはり値段の節です。

下げるときは値段の節として、機能しているようです。

今後の上げの時も踏み台になりそうな価格だとみています。

つまり、上げるときのシナリオは、一旦1400ドルをつけて、押しが入り1340ドルでヒゲを出して、新高値へGOなどが考えられます。

We find out 1340 point around will work as resistance and support.

And this will mean this price will be watershed of the market.

We can provide a scenario.

In future, when a true bull market will come, the price take 1400 point over first and will take a dip at 1340 point around and start a big rally.

chart3_conv


★★レポート作成時データのダウンロード★★

ブログで使用したデータをダウンロードしていただけます。

内容により非提供の場合があります。


相場分析のリクエストがありましたら“Contact Us”からお知らせください。ご要望にお応えできるように努力いたします。

このブログはあくまでも個人的な見解であり、投資判断は各自でお願い致します。当ブログは一切の投資損益に対する責任を負いません。

ブログに来て下さってありがとうございます。明日もよろしくお願いいたします。

If you have some request to analyze, please write to “Contact Us”.

We do best effort for your request.

These are only personal opinions on this blog, and you need the investment judgment in each one. This blog doesn’t assume the responsibility to all the investment profit and loss.

Thank for watching our contents. My best regards next day.

如果您需要行情分析,请点击“Contact Us”联系我们。我们将尽力满足您的要求。

本博客仅为个人意见,请各自做出投资判断。本博客概不对任何投资盈亏负责。

感谢您访问本博客。欢迎再次使用。

© 2025 Retar