2018/06

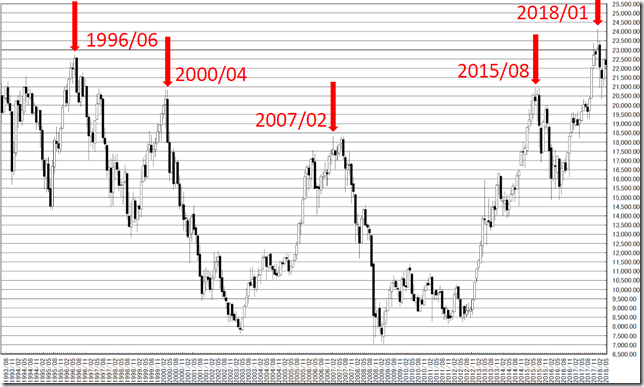
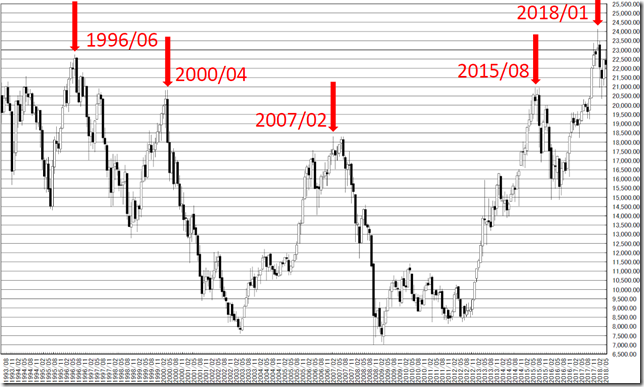
日経平均・1996年、2000年、2007年、2015年の大天井との比較・2007年のようになるなら「掉尾の一振」に期待だが、5月中旬からの戻りに弱さがみられるため期待薄

2018/06/20

日経平均・1996年、2000年、2007年、2015年の大天井との比較・2007年のようになるなら「掉尾の一振」に期待だが、5月中旬からの戻りに弱さがみられるため期待薄

Nikkei 225; comparing 1996, 2000, 2007 and 2015 peaks; if the price will follow 2007 price movement, we can expect “TOUBI NO ISSHIN”; but recovery becomes weak form mid-May.

日经225。比较现在和1996年,2000年,2007年,2015年的峰值。因为从5月中旬以来可能会出现弱,所以不能期待。


私たちが学習したことは「23000円以上は陶酔の世界」らしい。

天井を打つ前と、打ったあとについて検証しています。

本日は天井を打つ前。

We studied “23000yen over is euphoria”.

We verify after peaked out and before peaked out.

Today is before peaked out.


さて、本日は天井付近でのクローズベースの新高値を調査しました。

このような議論が必要になるのは、今頃25000円ぐらいをつけていれば良かっただけの話です。

Now, we survey close price based new high in past market.

If the price is 25000yen over now, we do not need to argue.

chart1_conv


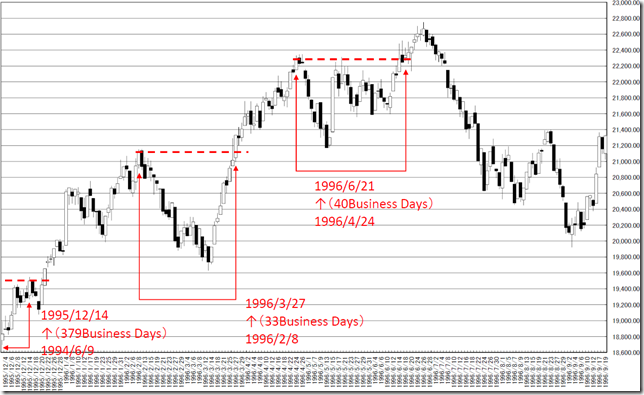
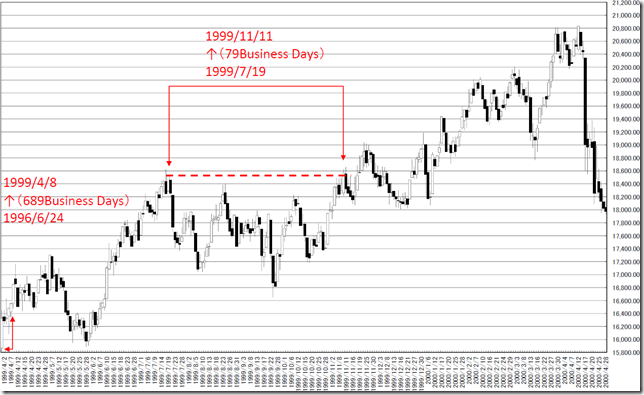
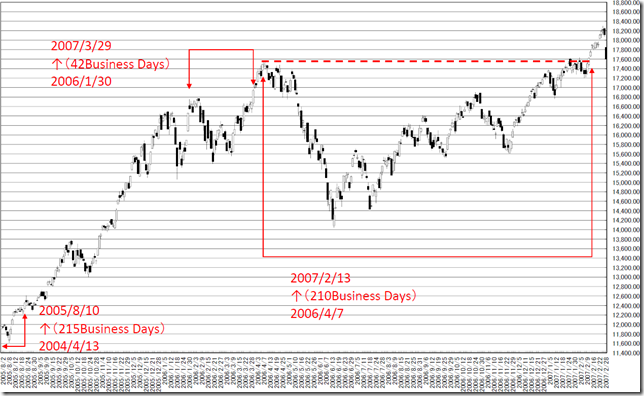
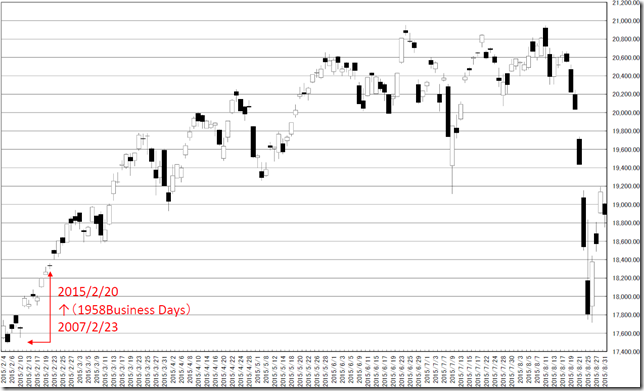
本日は天井圏付近で新高値をとったあとに次の新高値をとるためには、どの程度の日数が必要か調べました。

結論は42営業日以内にクローズベースの新高値をとらなければ、上昇相場を疑っても良いと言えます。

しかし、例外もあり、79営業日で戻した1999年の例や、210営業日で戻した2007年の例があります。

We survived how many days does it need taking new high in the next peak.

Our conclusion is if the price does not take new high within 42 business days, we can doubt rally.

But there were some exceptions; in 1999 and 2007 cases.


1996_conv2000_conv2007_conv

2015_conv

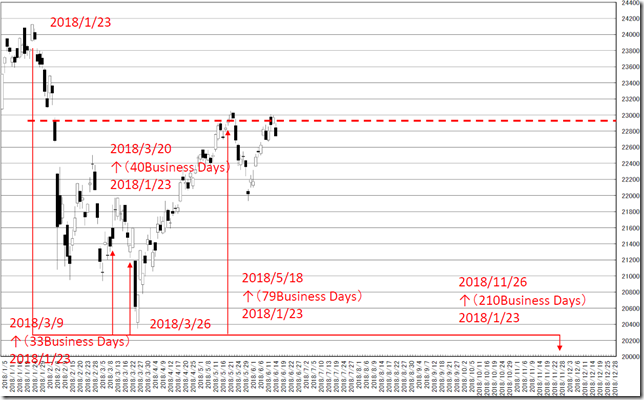
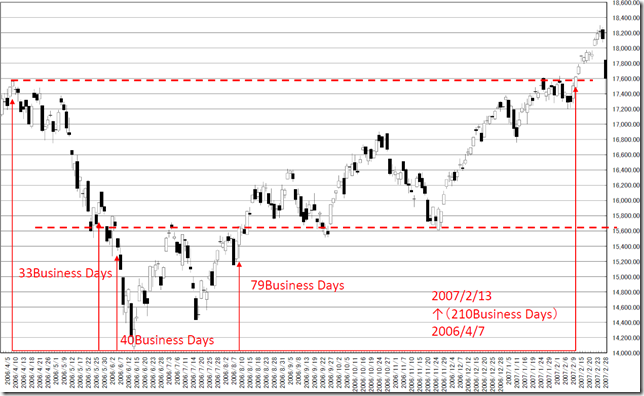
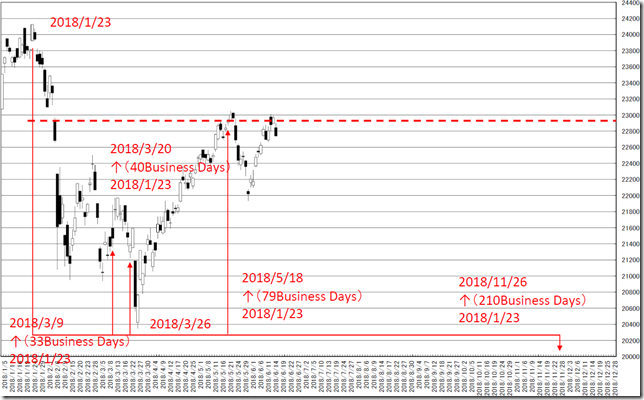
現在の状況を当てはめると、42営業日付近とは底付近であり、79営業日付近で変化した点が、2007年相場と似ているとも言えます。

しかし、2007年相場と異なるのは、79手のクローズ付近がサポートとなっていましたが、現在は23000円付近がレジスタンスです。

Applying to this occasion to the latest market, 42 business days were bottom around and 79 business days were “HENKA” zone and this is similar to 2007 case.

79 business days worked as support zone in 2007 but is not so.

2018_conv

2007-02_conv


★★レポート作成時データのダウンロード★★

ブログで使用したデータをダウンロードしていただけます。

内容により非提供の場合があります。


相場分析のリクエストがありましたら“Contact Us”からお知らせください。ご要望にお応えできるように努力いたします。

このブログはあくまでも個人的な見解であり、投資判断は各自でお願い致します。当ブログは一切の投資損益に対する責任を負いません。

ブログに来て下さってありがとうございます。明日もよろしくお願いいたします。

If you have some request to analyze, please write to “Contact Us”.

We do best effort for your request.

These are only personal opinions on this blog, and you need the investment judgment in each one. This blog doesn’t assume the responsibility to all the investment profit and loss.

Thank for watching our contents. My best regards next day.

如果您需要行情分析,请点击“Contact Us”联系我们。我们将尽力满足您的要求。

本博客仅为个人意见,请各自做出投资判断。本博客概不对任何投资盈亏负责。

感谢您访问本博客。欢迎再次使用。


日経平均・1996年、2000年、2007年、2015年の大天井との比較・大天井から79営業日の付近がレジスタンスとなれば大天井臭さ満点・現在の状況に当てはめると22930.36円付近が鉄板なら要注意

2018/06/19

日経平均・1996年、2000年、2007年、2015年の大天井との比較・大天井から79営業日の付近がレジスタンスとなれば大天井臭さ満点・現在の状況に当てはめると22930.36円付近が鉄板なら要注意

Nikkei 225; comparing 1996, 2000, 2007 and 2015 peaks; when 79 business days from the major peak works as resistance, this will be perfect peak; Applying this to the latest market, this zone is 22930.36yen around.

日经225。比较现在和1996年,2000年,2007年,2015年的峰值。当从主峰79个工作日内可以作为阻力,这将是完美的高峰。这个区域是22930.36日元左右。


天井を打つ前と、打ったあとについて検証しています。

本日は天井を打ったあと。

We verify after peaked out and before peaked out.

Today is after peaked out.


何処かの怪しい国ではありませんが、標語作りは嫌いではありません。

「今後の標語は「心に刻もう22976.17円」。相場見通しは22976.17円をスッパリ抜けるのかどうかの1点にかかっているとも言えます。」(2017/1/4)

改めて検証すると現在の値動きそのものです。

そして、いまはレンジ上限一杯。

We reported “We will need to remind 22976.17yen in future! Our view will be based on the price will cut 22976.17yen or not” in 1/4/2017.

Reviewing our report, now is so.

And now is upper side of the steadiness.


結論は天井からの79手付近は値段の節。

2018/1/23が大天井ならば、23000円付近をスッパリ抜けるはずだが、そうならないため、過去に類似している。

Today’s conclusion is 79 business days from the major peak worked as resistance.

If 1/23/2018 will be major peak, the price will easily cut 23000yen but it was not so.

chart1_conv


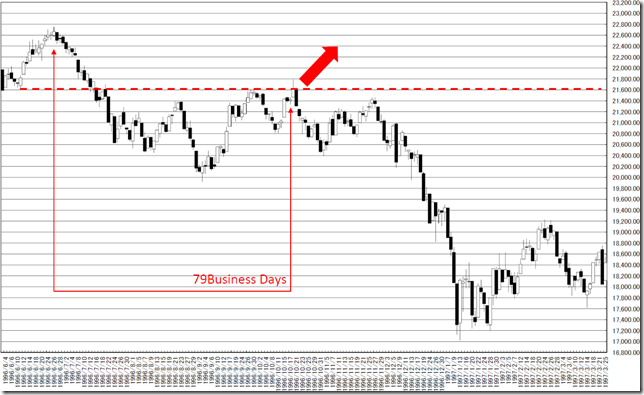
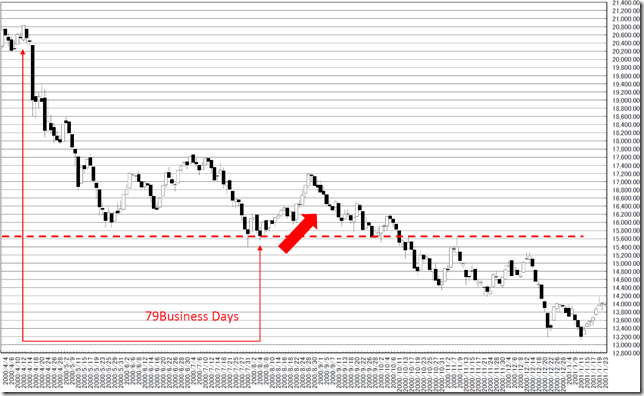
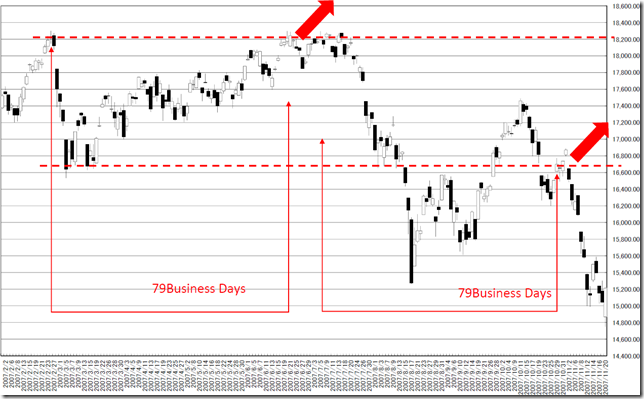
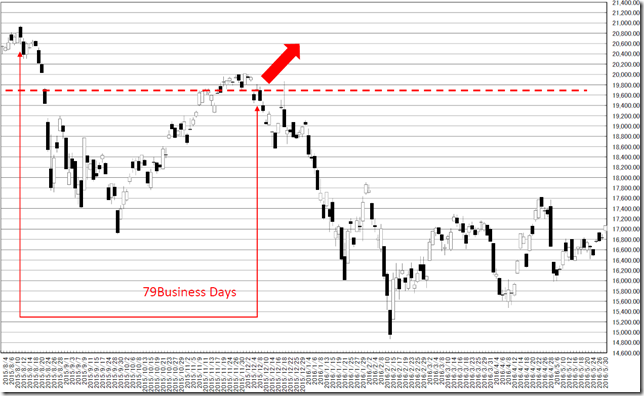
天井からの79手のクローズに赤線をいれています。

2000年を除き、この付近がレジスタンスです。

最近の状況に当てはめると、23000円で頭を抑え込まれているため、日柄的にも大天井臭さ満点です。

現在の状況は1996年相場と似ているような気がしていますがいかがでしょうか。

We marked the 79 business day’s close price from the major peak.

Excepting 2000 pattern, this zone worked as resistance.

Applying this occasion to the latest market, 23000yen around worked as resistance and this zone is reasonable from the point of “HIGARA” view.

Now is similar to 1996 market and how do you feel?

1996_conv2000_conv2007_conv2015_conv2018_conv


★★レポート作成時データのダウンロード★★

ブログで使用したデータをダウンロードしていただけます。

内容により非提供の場合があります。


相場分析のリクエストがありましたら“Contact Us”からお知らせください。ご要望にお応えできるように努力いたします。

このブログはあくまでも個人的な見解であり、投資判断は各自でお願い致します。当ブログは一切の投資損益に対する責任を負いません。

ブログに来て下さってありがとうございます。明日もよろしくお願いいたします。

If you have some request to analyze, please write to “Contact Us”.

We do best effort for your request.

These are only personal opinions on this blog, and you need the investment judgment in each one. This blog doesn’t assume the responsibility to all the investment profit and loss.

Thank for watching our contents. My best regards next day.

如果您需要行情分析,请点击“Contact Us”联系我们。我们将尽力满足您的要求。

本博客仅为个人意见,请各自做出投资判断。本博客概不对任何投资盈亏负责。

感谢您访问本博客。欢迎再次使用。

© 2025 Retar