2019/01

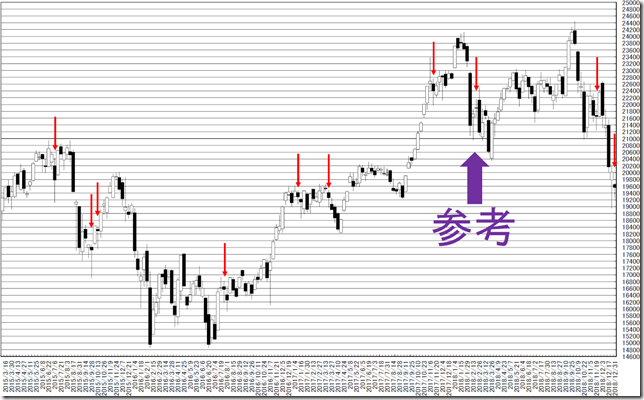
日経平均週足・羽黒9号線・底堅さを示す型だが、実体抜きすると更なる下落

2019/01/04

日経平均週足・羽黒9号線・底堅さを示す型だが、実体抜きすると更なる下落

NIKKEI 225 Weekly; “HAGURO” No.9 formation; this formation often implies stable; cutting the shadow, this will be start of falling.

日经225。羽黑9号线。这个阵型往往意味着稳定。如果切割阴影,就是下降的开始。


本日は日経平均週足についてです。

Today’s analyze is NIKKEI 225 weekly.


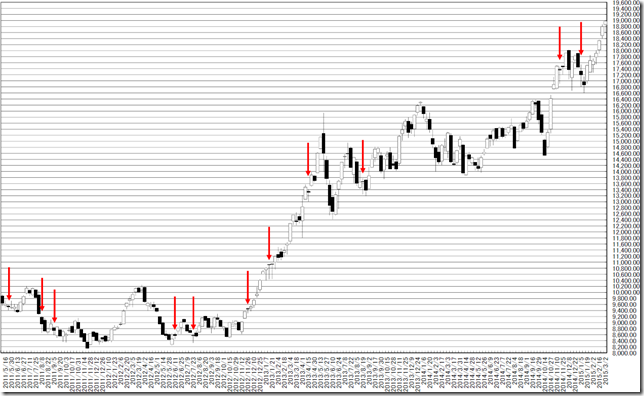
週足線では羽黒9号線となりました。

400週で21回出現しています。

下ヒゲを実体抜きすれば下落です。

しかし、先週の3号線とあわせ底堅い動きになるのではないかとみています。

しばらくは「売り方やめ」だとみています。

In this week, the market price formed “HAGURO” No.9 formation.

In past 400 weeks, it appeared 21 times.

Cutting lower shadow with candle stick body will be start of falling.

But last week was No.3 formation and stable market will continue for some time.

Falling will stop for some time but it will start after that.

chart1_convchart2_conv


★★レポート作成時データのダウンロード★★

ブログで使用したデータをダウンロードしていただけます。

内容により非提供の場合があります。


相場分析のリクエストがありましたら“Contact Us”からお知らせください。ご要望にお応えできるように努力いたします。

このブログはあくまでも個人的な見解であり、投資判断は各自でお願い致します。当ブログは一切の投資損益に対する責任を負いません。

ブログに来て下さってありがとうございます。明日もよろしくお願いいたします。

If you have some request to analyze, please write to “Contact Us”.

We do best effort for your request.

These are only personal opinions on this blog, and you need the investment judgment in each one. This blog doesn’t assume the responsibility to all the investment profit and loss.

Thank for watching our contents. My best regards next day.

如果您需要行情分析,请点击“Contact Us”联系我们。我们将尽力满足您的要求。

本博客仅为个人意见,请各自做出投资判断。本博客概不对任何投资盈亏负责。

感谢您访问本博客。欢迎再次使用。


日経平均年足の分析(2)・2007年天井は大いに参考になりそう・年前半のレジスタンスは21000円、サポートは17000円台後半

2019/01/03

日経平均年足の分析(2)・2007年天井は大いに参考になりそう・年前半のレジスタンスは21000円、サポートは17000円台後半

NIKKEI 225 annual No.2; now is similar to the 2007’s occasion; First half of this year, the support is 17000yen high and resistance will be 21000yen around.

日经225。年K的分析(2)。现在类似于2007年的场合。今年上半年,支持是17000日元高位,阻力是21000日元左右。


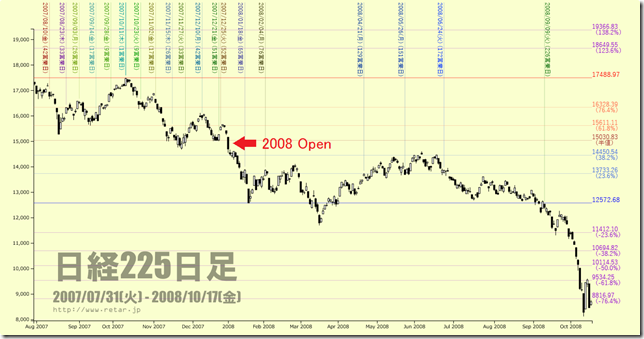
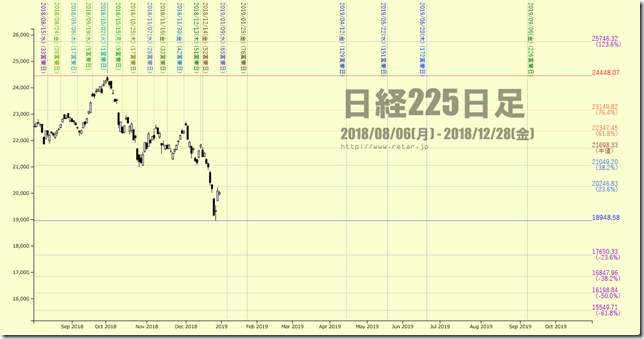
2007年の下落軌道をもとに今年を想定してみました。

2007年の下落開始地点は、2007/10/11。

2018年の下落開始地点は、2018/10/02。

ソックリなのは10月天井です。

We estimate this year’s price movement by 2007’s movement.

The start of falling in 2007 was 10/11/2007.

And the start of falling in 2018 was 10/2/2018.

This occasion is similar.


2007年の特徴は「お年玉売り」です。

そうなれば、図版のフィボナッチも「お年玉の下駄履き」状態だとみてください。

大切なのは日柄です。

2007年の場合は天井から67手まで下落していました。

2019年現在の相場に引き直すと67手は2019/1/11。

The unique character in 2007 is falling started at the begging of the year.

And our Fibonacci may be wrong.

The most important point is “HIGARA”.

In 2007 case, the price stopped falling in 67 business days.

Applying this to the latest case, 67 business days is 1/11/2019.

chart1_2007HigaraViewchart2_2018HigaraView


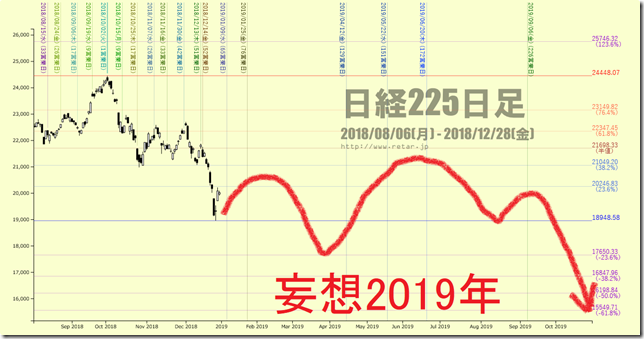
妄想軌道も書いてみました。

3月末まで売られ、6月天井というイメージになるでしょう。

This is estimated price movement.

chart3_2018HigaraView_2


★★レポート作成時データのダウンロード★★

ブログで使用したデータをダウンロードしていただけます。

内容により非提供の場合があります。


相場分析のリクエストがありましたら“Contact Us”からお知らせください。ご要望にお応えできるように努力いたします。

このブログはあくまでも個人的な見解であり、投資判断は各自でお願い致します。当ブログは一切の投資損益に対する責任を負いません。

ブログに来て下さってありがとうございます。明日もよろしくお願いいたします。

If you have some request to analyze, please write to “Contact Us”.

We do best effort for your request.

These are only personal opinions on this blog, and you need the investment judgment in each one. This blog doesn’t assume the responsibility to all the investment profit and loss.

Thank for watching our contents. My best regards next day.

如果您需要行情分析,请点击“Contact Us”联系我们。我们将尽力满足您的要求。

本博客仅为个人意见,请各自做出投资判断。本博客概不对任何投资盈亏负责。

感谢您访问本博客。欢迎再次使用。

© 2025 Retar