東京円建て金週足・レンジ上限到達後、失速か?/Tokyo market gold calculated in yen. The market price went up to upper side limit and may fall? /东京市场的黄金。到上限后,是不是失速?
東京円建て金週足・レンジ上限到達後、失速か?
Tokyo market gold calculated in yen. The market price went up to upper side limit and may fall?
东京市场的黄金。到上限后,是不是失速?
本日は東京円建て金を分析します。
Today we analyze Tokyo market gold calculated in yen.
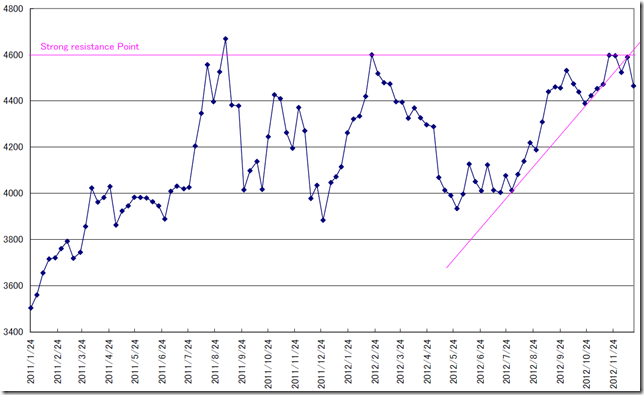
週足終値のチャートです。
4600円がレジスタンスのようです。
3回失敗しています。
This is weekly close price chart.
4600point worked as the resistance point.
The market price challenge 3 times and fail.
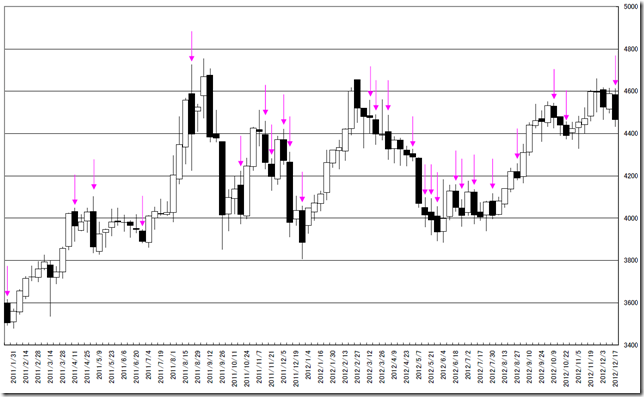
先週は羽黒10号線(16号線)を出しました。
10号線はよく出る線であり、高値抜きまたは安値抜きから考えよとテキストに書いてあります。
このフォーメーションはダマシのことも多く参考にしない方がいいかもしれません。
Last week, the market price formed “HAGURO” No.10 (No.16) formation.
No. 10 formation often appears and cutting high or low means the market direction.
This formation often becomes fake point and we should not refer it.
相場分析のリクエストがありましたら“Contact Us”からお知らせください。ご要望にお応えできるように努力いたします。
このブログはあくまでも個人的な見解であり、投資判断は各自でお願い致します。当ブログは一切の投資損益に対する責任を負いません。
ホームページに来て下さってありがとうございます。明日もよろしくお願いいたします。
If you have some request to analyze, please write to “Contact Us”.
We do best effort for your request.
These are only personal opinions on this blog, and you need the investment judgment in each one. This blog doesn’t assume the responsibility to all the investment profit and loss.
Thank for watching our contents. My best regards next day.


