
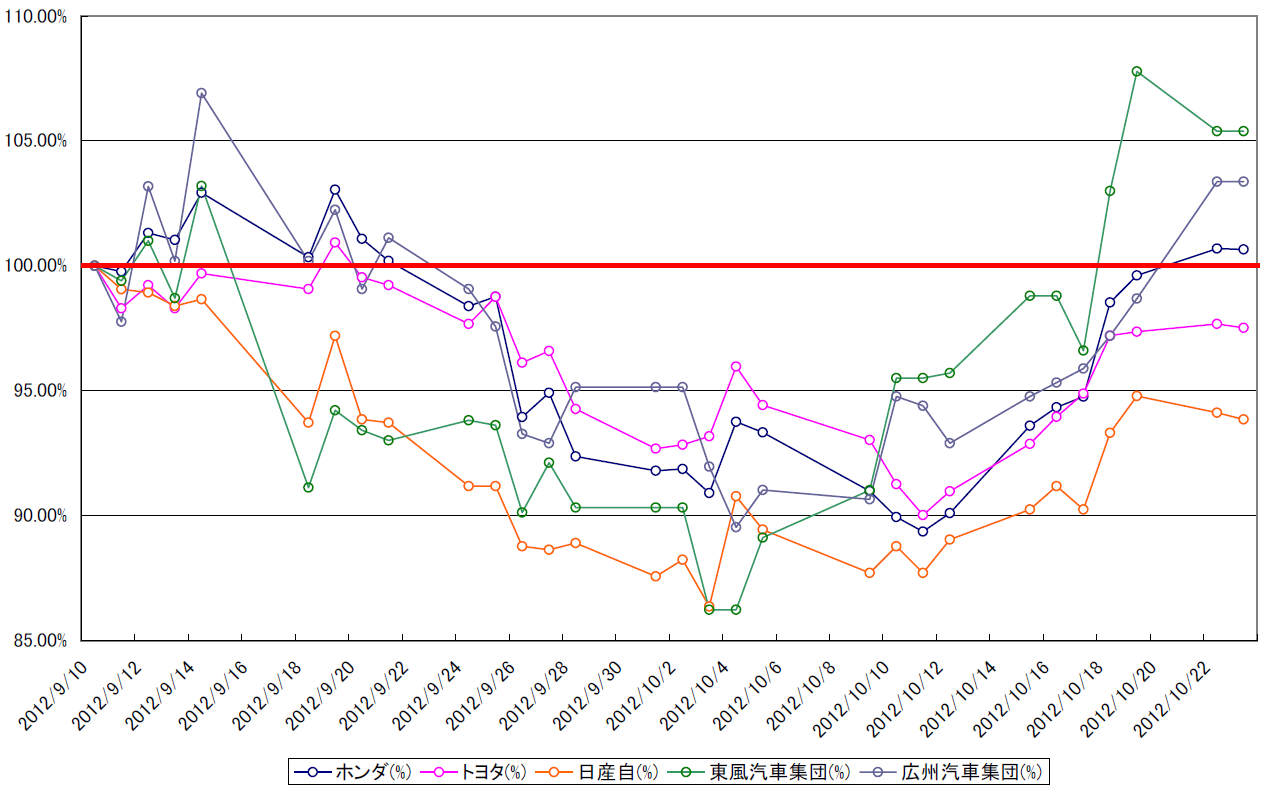
2012/09/10以降の日中自動車メーカーの株価比較/Comparing the stock price of Chinese and Japanese auto manufacturers after 09/10/2012. /比较了2012年09月10日以后的日中汽车制造厂的股票价格。

2012/10/24

2012/09/10以降の日中自動車メーカーの株価比較

Comparing the stock price of Chinese and Japanese auto manufacturers after 09/10/2012.

比较了2012年09月10日以后的日中汽车制造厂的股票价格。


2012/10/24の日経新聞の朝刊6面に「点検中国ミクロ景気 不買の代償、縮む生産」という記事が載っていました。

文中の一節に「日産、トヨタ、ホンダの株も一時1割前後下げたが、合弁相手ほどではない」という記事がありました。

チャートは「トヨタ」、「ホンダ」、「日産」、「東風汽車集団」、「広州汽車集団」の五社の2012/09/10終値を100%として、価格変動を調査しています。

この区間の最低値は「トヨタ90.02%」、「ホンダ89.36%」、「日産86.36%」、「東風汽車集団86.23%」「広州汽車集団89.53%」となります。

記事中では「合弁相手ほどではない」と言っているにも関わらず、ホンダは東風汽車集団や広州汽車集団よりも下げています。

新聞記事は、必ず徹底的に検証しましょう。

Today, we can see “Checking China’s micro business; compensation of a boycott and shrinking of Production” on the 6th page of the morning paper article of the Nikkei newspaper.

The part of this article says “NISSAN, TOYOTA and HONDA stock price was lowered below ten percent temporarily”.

This is the char of NISSAN, TOYOTA, HONDA, Dongfeng Motor Group Co., Ltd. and Guangzhou Automobile Group Co., Ltd.

We treat as 100% as 09/10/2012 each of closed price and how did it became.

The lowest point of each stock is these; “TOYOTA: 90.02%”,”HONDA: 89.36%”,”NISSAN: 86.36%”,” Dongfeng: 86.23%” and “Guangzhou: 89.53%”.

Despite the article says "It is not as a joint partner”, Honda became lower than Dongfeng or the Guangzhou.

Be sure to verify a newspaper article thoroughly.
CHART


相場分析のリクエストがありましたら“Contact Us”からお知らせください。ご要望にお応えできるように努力いたします。

このブログはあくまでも個人的な見解であり、投資判断は各自でお願い致します。当ブログは一切の投資損益に対する責任を負いません。

ホームページに来て下さってありがとうございます。明日もよろしくお願いいたします。

If you have some request to analyze, please write to “Contact Us”.

We do best effort for your request.

These are only personal opinions on this blog, and you need the investment judgment in each one. This blog doesn’t assume the responsibility to all the investment profit and loss.

Thank for watching our contents. My best regards next day.
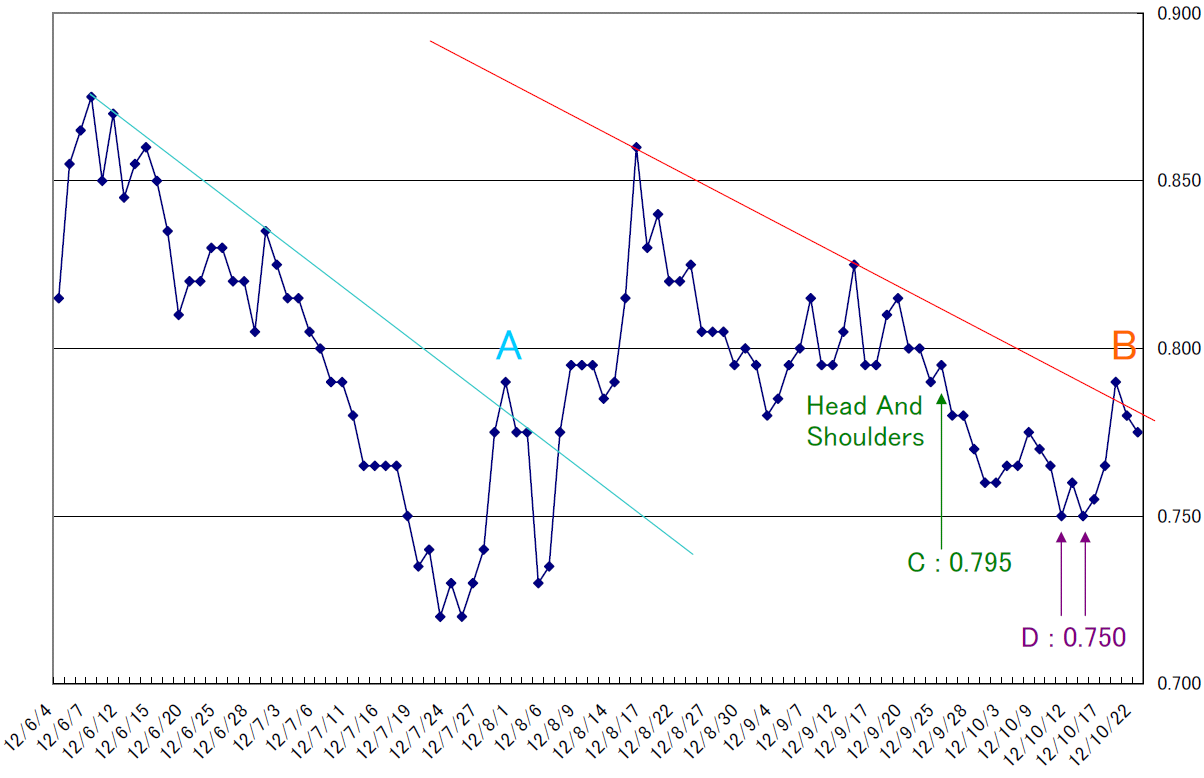
日本10年債利回り日足・上方ブレークは0.795ポイント、下方ブレークは0.750ポイント/Japanese Government Bonds 10-Year Daily; the upper side breaking point is 0.795point and the down side breaking point is 0.750point. /日本政府债券10年期的上边突破点是0.795点和下边突破点是0.750点。

2012/10/23

日本10年債利回り日足・上方ブレークは0.795ポイント、下方ブレークは0.750ポイント

Japanese Government Bonds 10-Year Daily; the upper side breaking point is 0.795point and the down side breaking point is 0.750point.

日本政府债券10年期的上边突破点是0.795点和下边突破点是0.750点。


本日は、日本10年債利回り日足の分析です。

Today, we analyze Japanese Government Bonds 10-Year Daily.


終値にトレンドラインを引いてみました。

B地点で超えていますので、一旦下げ止まってきた気配があります。

前回のA地点と似通った動きです。

今回の注目点はC地点とD地点です。

C地点は三尊を形成した後、ネックラインの到達に失敗をして、下方に落っこちるパターンです。

C地点の値は0.795ポイントであり、今後この水準は重要なブレークポイントとなると考えられます。

一方、D地点でもダブルボトムを形成しており、0.750ポイントを下回ると再下落する可能性が高まります。

We add the trend lines on the closed price chart.

The market price once cut the trend line at “B” point.

This is similar to “A” point.

We think “C” and “D” points are resistance and support.

At “C” point, the market price formed “Head and Shoulders” formation and failed to going upside and felled again.

“C” point is 0.795 point and this price will become upper side breaking point.

On the other hand, the market price formed double dip at “D” point and if the market price will cut it, it may re-fall.

CHART


相場分析のリクエストがありましたら“Contact Us”からお知らせください。ご要望にお応えできるように努力いたします。

このブログはあくまでも個人的な見解であり、投資判断は各自でお願い致します。当ブログは一切の投資損益に対する責任を負いません。

ホームページに来て下さってありがとうございます。明日もよろしくお願いいたします。

If you have some request to analyze, please write to “Contact Us”.

We do best effort for your request.

These are only personal opinions on this blog, and you need the investment judgment in each one. This blog doesn’t assume the responsibility to all the investment profit and loss.

Thank for watching our contents. My best regards next day.

© 2026 Retar