本日も引き続きTOPIX日足についてです。
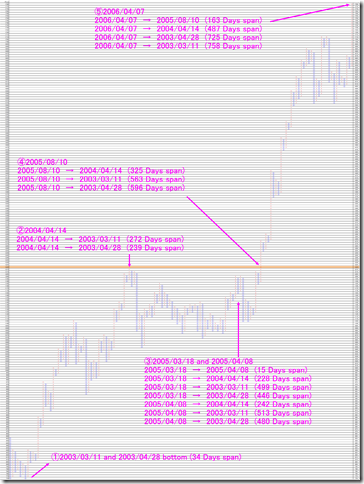
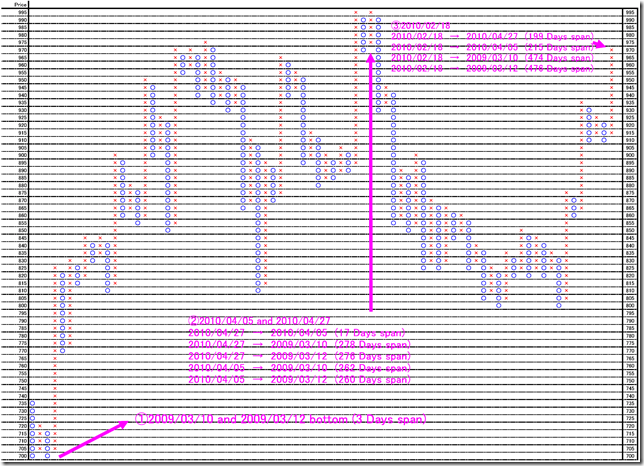
2003-2006年相場と似ているか日柄で分析してみました。
状況を分析してみると3つの段階から見て取ることができます。
Today we follow analyze TOPIX (Tokyo stock Price Index) daily.
We analyze “HIGARA” similar to 2003-2006 market or not.
We characterize 3 phase.
|
Phase X to Y |
Year 2003-2006 |
Year 2009-2011 |
|
Phase 1 to 2 |
239-272 days span |
260-278 days span |
|
Phase 2 to 3 |
228-242 days span |
199-215 days span |
|
Phase 1 to 3 |
446-513 days span |
474-476 days span |
同じことが起こっていると考えるのであれば、もう少し日柄調整が必要だと考えられます。
現在の相場はそろそろ天井を打ち、深押ししてもおかしくないと思います。
If we consider “Now recent market is similar to 2003-2006”, I think more “HIGARA” we need.
I think the market may be peak, and may go down side.
相場分析のリクエストがありましたら“Contact Us”からお知らせください。ご要望にお応えできるように努力いたします。
このブログはあくまでも個人的な見解であり、投資判断は各自でお願い致します。当ブログは一切の投資損益に対する責任を負いません。
ホームページに来て下さってありがとうございます。明日もよろしくお願いいたします。
If you have some request to analyze, please write to “Contact Us”.
We do best effort for your request.
These are only personal opinions on this blog, and you need the investment judgment in each one. This blog doesn’t assume the responsibility to all the investment profit and loss.
Thank for watching our contents. My best regards next day.


