2014/06

日経平均日足・15018.78円に軽いサポート、14830.99ポイントにレンジ下限/NIKKEI 225 Daily; 15018.78point and 14830.99point will work as support. /日经225。15018.78点和14830.99点将工作的支持。

2014/06/27

日経平均日足・15018.78円に軽いサポート、14830.99ポイントにレンジ下限

NIKKEI 225 Daily; 15018.78point and 14830.99point will work as support.

日经225。15018.78点和14830.99点将工作的支持。


本日は日経平均日足についてです。

Today’s analyze is NIKKEI 225 daily.

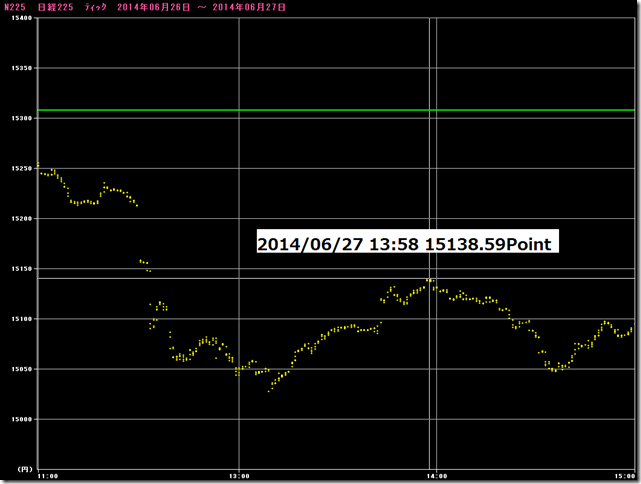
ティックで確認すると、15136.83円はサポートだったようです。

一番重要なのが、2014/06/05を起点とする持ち合いのようです。

相場の尻尾をつかんだようです。シナリオが組立やすくなりました。

この先、15018.78円に軽いサポート、14830.99ポイントにレンジ下限があります。(2014/06/25レポート参照

15136.83point worked as support; the start of steadiness is 06/05/2014 and this must be the best important.

We can build up scenario more easily.

There are two support points; 15018.78point and 14830.99point. (See 06/25/2014 report)

CHART


相場分析のリクエストがありましたら“Contact Us”からお知らせください。ご要望にお応えできるように努力いたします。

このブログはあくまでも個人的な見解であり、投資判断は各自でお願い致します。当ブログは一切の投資損益に対する責任を負いません。

ホームページに来て下さってありがとうございます。明日もよろしくお願いいたします。

If you have some request to analyze, please write to “Contact Us”.

We do best effort for your request.

These are only personal opinions on this blog, and you need the investment judgment in each one. This blog doesn’t assume the responsibility to all the investment profit and loss.

Thank for watching our contents. My best regards next day.

如果您需要行情分析,请点击“Contact Us”联系我们。我们将尽力满足您的要求。

本博客仅为个人意见,请各自做出投资判断。本博客概不对任何投资盈亏负责。

感谢您访问本博客。欢迎再次使用。


NY金・2010年代の上昇と1970年代の上昇局面は似ている/NY GOLD; there are similarity between 2010’s and 1970’s. /纽约黄金。也有2010年代和1970年代之间的相似性。

2014/06/26

NY金・2010年代の上昇と1970年代の上昇局面は似ている

NY GOLD; there are similarity between 2010’s and 1970’s.

纽约黄金。也有2010年代和1970年代之间的相似性。


本日はNY金を分析します。

Today we analyze NY gold.

2011/9/9の週にNYゴールドは高値をつけましたが、それ以降、新高値はとれていません。

「新高値をとれないモジモジ」というのは1970年代の相場にもありました。(2014/06/23レポート参照)

The market price took the highest in 9/9/2011 week and cannot took new high.

There was similar market in 1970’s. (See 06/23/2014 report)

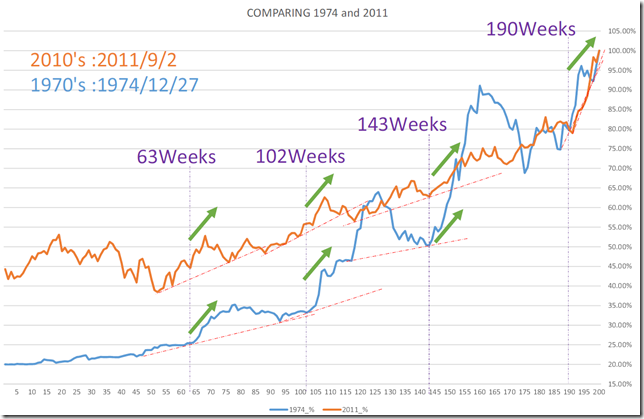
終値ベースで高値をつける前までの比較をおこないました。

高値をとるまでの間の200週間の上場率は、1974年では約5倍(開始1971/2/12週)、2011年では約2.2倍(開始2007/11/9週)でした。

2011年の上げは1974年の相場と比較しても、マイルドな上げでした。

日柄的には類似性がみられます。

上昇角度を変化させる地点は、63,102,143,190週となりました。

We compare the close price.

The rate for 200 weeks until it took the highest price was about five in 1974 (start 1971/2/12 week), and was about 2.2 in 2011 (start 2007/11/9 week).

Jumping in 2011 was milder than 1974 market.

From “HIGARA” view, there are similarities.

The jumping rate changing points are 63, 102,143 and 190 weeks.

CHART


相場分析のリクエストがありましたら“Contact Us”からお知らせください。ご要望にお応えできるように努力いたします。

このブログはあくまでも個人的な見解であり、投資判断は各自でお願い致します。当ブログは一切の投資損益に対する責任を負いません。

ホームページに来て下さってありがとうございます。明日もよろしくお願いいたします。

If you have some request to analyze, please write to “Contact Us”.

We do best effort for your request.

These are only personal opinions on this blog, and you need the investment judgment in each one. This blog doesn’t assume the responsibility to all the investment profit and loss.

Thank for watching our contents. My best regards next day.

如果您需要行情分析,请点击“Contact Us”联系我们。我们将尽力满足您的要求。

本博客仅为个人意见,请各自做出投资判断。本博客概不对任何投资盈亏负责。

感谢您访问本博客。欢迎再次使用。

© 2024 Retar