2016/01

東京円建て金・トレンドライン分析・重要サポートで止まり反転。しかしアヤ戻し臭い/ Tokyo market gold; trend line analysis; the price stopped at the major support but this seems to be only technical rebound. /东京市场的黄金。趋势线分析。价格停在了重要支撑,但这似乎只是技术反弹的。

2016/01/27

東京円建て金・トレンドライン分析・重要サポートで止まり反転。しかしアヤ戻し臭い

Tokyo market gold; trend line analysis; the price stopped at the major support but this seems to be only technical rebound.

东京市场的黄金。趋势线分析。价格停在了重要支撑,但这似乎只是技术反弹的。


本日は東京円建て金についてです。

落ちてくるナイフはつかむな

Today we analyze Tokyo market gold calculated in yen.

“Don’t catch a falling knife”


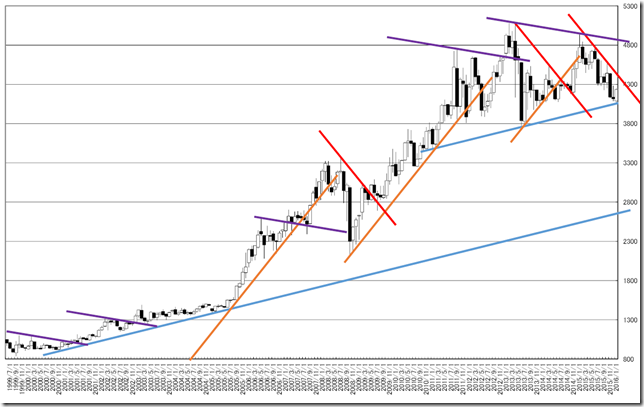
月足では青色で停止しており、反転する地点としては大納得です。

参加者が青を意識したトレードをしていたことは間違いないとみています。

月足的には何事もなくあがっていっても、不思議さはありません。

In monthly chart, the market price stopped at blue line and reversed and this is reasonable.

Market attendance noticed the blue line and it worked well.

This may be a start of new bull trend and this is natural.

MONTH


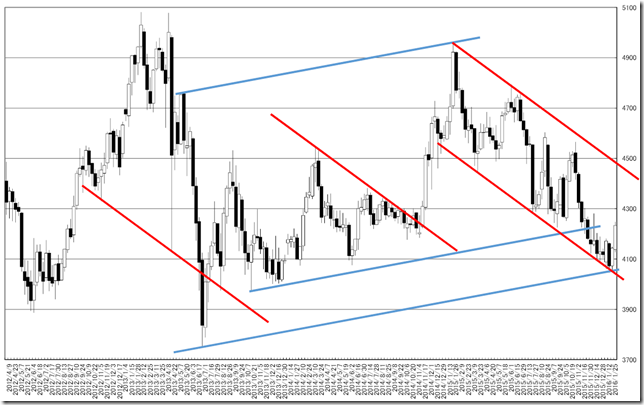
週足もチャネルの下限をサポートに下落したため、これも戻す点では納得です。

しかし、2015/12/08のレポートでは「東京円建て金週足・トレンドライン分析・重要サポートで止まっていますが、本物の買い場はオーバーシュート待ちか」と報告しています。

私たちはオーバーシュートを待っていましたが、オーバーシュートせずに反転しました。

いまだバンドウォークしている相場であり、今のところ、本当の大底には見えていません。

アヤ戻しがメインシナリオであり、本物の反転確認には、さらなる証拠が必要です。

In weekly chart, the market price reached the outer support and reversed and this is reasonable.

But we reported “Tokyo market gold weekly; trend line analysis; the price stopped at the major support and a real buying point will be over shooting” in 12/08/2015.

We waited for an over shooting but the market price did not be so.

This is the meaning of the market price is still running the down side channel and the latest lowest does not seem to be the major bottom.

Our main scenario is “now is technical rebound” and we need more evidence for confirming the major bottom.

week


相場分析のリクエストがありましたら“Contact Us”からお知らせください。ご要望にお応えできるように努力いたします。

このブログはあくまでも個人的な見解であり、投資判断は各自でお願い致します。当ブログは一切の投資損益に対する責任を負いません。

ホームページに来て下さってありがとうございます。明日もよろしくお願いいたします。

If you have some request to analyze, please write to “Contact Us”.

We do best effort for your request.

These are only personal opinions on this blog, and you need the investment judgment in each one. This blog doesn’t assume the responsibility to all the investment profit and loss.

Thank for watching our contents. My best regards next day.

如果您需要行情分析,请点击“Contact Us”联系我们。我们将尽力满足您的要求。

本博客仅为个人意见,请各自做出投资判断。本博客概不对任何投资盈亏负责。

感谢您访问本博客。欢迎再次使用。


日経平均日足・変化日2016年2月1日から3日・動きはそこからか?/NIKKEI 225 daily; “HENKABI” is from 02/01/2016 to 02/03/2016; A new trend may come at that time. /日经225。“变化日”是从2016年2月1号到2016年2月3号。一种新的趋势可能会在那个时候。

2016/01/26

日経平均日足・変化日2016年2月1日から3日・動きはそこからか?

NIKKEI 225 daily; “HENKABI” is from 02/01/2016 to 02/03/2016; A new trend may come at that time.

日经225。“变化日”是从2016年2月1号到2016年2月3号。一种新的趋势可能会在那个时候。


本日は日経225日足についてです。

Today is about N225 daily.


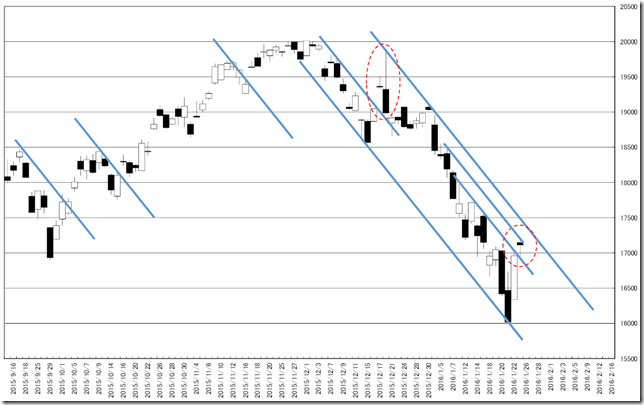
トレンドラインでは、チャネリングしているため、下方向へのトレンドが継続しているとみています。

最外郭を抜けるとトレンドの変化がみられる地点となります。

The market price is running the channel and bearish market is still going on.

If the market price will cut the most outer line this may be a start of new trend.

chart1


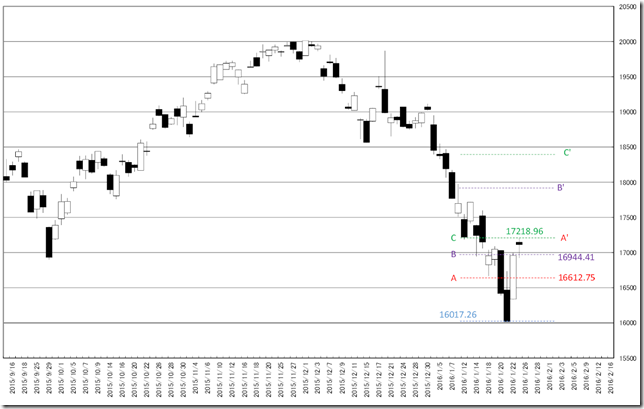
今後の重要な値段の節となりそうなのが、A: 16612.75円(2016/1/25高値と2016/1/21安値の半値)、B:16944.41円(2016/01/16安値か2016/1/18・絡み合う値段)、C:17218.96円(2015/1/25高値)。

これらから求まる相場の基点は、2016/1/20、2016/1/18、2016/1/12。

半値基点を2016/1/18として、2016/1/18からの9手は、既に反転しているところであり、2016/01/21は底打ちした可能性を秘めています。

2016/01/14のレポートでも「日経平均日足・変化日は2016年1月20日、21日・それで許してもらえるか?」と報告しており、すでに底打ちした可能性を秘めています。

The important support and resistance point will be A: 16612.75yen (the half price between 01/25/2016 high and 01/21/2016 low), B: 16944.41yen (01/16/2016 low or 01/18; many high and low price was supported and resisted) and C: 17218.96 yen (1/25/2016 high).

The start of the market steadiness are 01/20/2016, 01/18/2016 and 01/12/2016.

When we define the start of the steadiness as 01/18/2016, the market price reversed in 9 business days and this may mean the market price has already stopped falling.

We reported “NIKKEI 225 daily; “HENKABI” is 01/20/2016 and 01/21/2016; but this may not seem to be the end” in 01/14/2016 and this is other reason.


波動の重なりの観点からみていくと、2016/02/01、2016/02/02、2016/02/03は興味深い時間帯です。

2016/02/01は、2016/01/20からの9手、2016/01/16からの13手、2015/09/29からの76+9手。

2016/02/02は、2015/12/01高値からの42手。

2016/02/03は、2015/08/11高値からの76+42手、2016/01/12からの17手。

2016/02/01以前に値段の節(レジスタンスとサポート)に関わる動きが出れば(17218.96円を超えるもしくは16017.26円を下回る動き)、ハッキリしますが、そうそううまくはいきません。

The view of wave concentration, we can know 02/01/2016, 02/02/2016 and 02/03/2016 are notable points.

02/01/2016 is the 9 business days from 01/20/2016and 13 business days from 01/16/2016 and 76+9 business days from 09/29/2015.

02/02/2016 is the 42 business days from 12/01/2015 high.

02/03/2016 is the 76+42 business days from 08/11/2015 high and 17 business days from 01/12/2016.

chart2


相場分析のリクエストがありましたら“Contact Us”からお知らせください。ご要望にお応えできるように努力いたします。

このブログはあくまでも個人的な見解であり、投資判断は各自でお願い致します。当ブログは一切の投資損益に対する責任を負いません。

ホームページに来て下さってありがとうございます。明日もよろしくお願いいたします。

If you have some request to analyze, please write to “Contact Us”.

We do best effort for your request.

These are only personal opinions on this blog, and you need the investment judgment in each one. This blog doesn’t assume the responsibility to all the investment profit and loss.

Thank for watching our contents. My best regards next day.

如果您需要行情分析,请点击“Contact Us”联系我们。我们将尽力满足您的要求。

本博客仅为个人意见,请各自做出投资判断。本博客概不对任何投资盈亏负责。

感谢您访问本博客。欢迎再次使用。

© 2024 Retar