テクニカル分析上の誤差をどう扱うか?
How to deal with the tolerance of the price on technical analysis?
技术分析价格的容许范围,怎样做?
Retar.jpの2016/04/28レポートに対して、以下のように質問をいただきました。
「羽黒法、週足の始値=高値となっています。 13号線、または誤差の許容範囲の取り方によっては、16号線かと思います。」
Last day, we got a question about 04/28 report.
“In your ‘HAGURO’ method, you treated the open price is same as the highest. But I think this is No.13 or No.16.”
この点について、お答えしたいと思います。
And we will answer this.
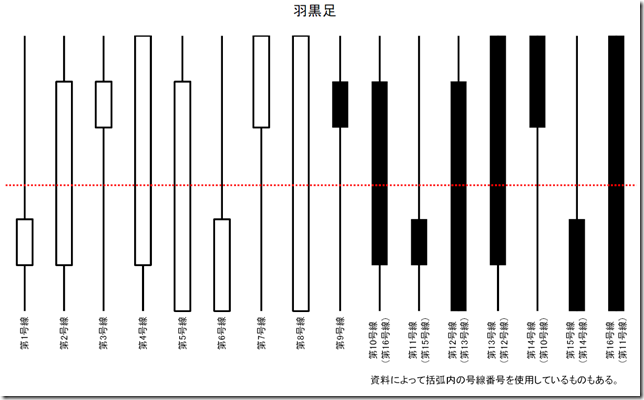
まず、はじめにRetar.jpでは羽黒足を、”羽黒11(16)号線”の形で表記しています。
その理由は書籍により2通りの記述があるからです。
大正や昭和初期のいくつかの書籍で調べると、羽黒足は本来陰陽非対称の記述のようで、もともとはカッコ内の番号を使っていたようです。
しかし、最近の書籍では陰陽対称の番号が使われています。
そこでRetar.jpとしては2つの番号を使って表記しています。
We introduce “HAGURO” formation as No.11 (16).
The reason why we write is we can see two type of books.
In old books from the Taisho to the early Showa period, “HAGURO” formation is written unsymmetrical in black and white candle stick.
But these days, symmetrical in black and white candle stick is in fashion.
So we use two types of writing.
テクニカル分析で、いつも課題となるのは、誤差の範囲です。
対策は簡単であり、誤差とは何かを決めるだけです。
個々人の裁量の挟む余地をなくし、誰がやっても同じ結果が得られるようにするためのルール決めが必要です。
ルールをどう決めるかがテクニカル分析の肝であり、改善の日々です。
In technical analysis, one of the most important thing is how to deal with the tolerance value.
The only method is defining what and how is the tolerance value.
We have to free from the room of our discretion and we must make the rule anyone can draw.
This is the main point of the technical analysis and we need to survey every day and need Kaizen.
羽黒足、トレンドライン、P&Fについて紹介したいと思います。
Today, we introduce the method of “HAGURO” formation, Trend line and P&F.
羽黒足の場合は、さまざまな閾値が考えられますが、簡単な方法としては、ヒゲの長さがろうそく足全体の何%であるかを決めてしまえば判定できます。
例えば1991年以降から先週まで1322週あります。
羽黒11(16)号線の場合、現在のRetar.jpで使用している閾値では約6%発生している線になります。
厳密に「ヒゲなし」とするならば、3通りしか発生しておらず、3/1322=0.22%となり、レアケースになります。
There are some method of treating the “upper and lower shadow” and the easiest method is you can define the percentages of the shadow.
For example, there are 1322 weeks from 1991 to last week.
Using our judging method, “HAGURO” No. 11(16) formation appeared 6%.
When we applying the strict judging rule (Shadow are zero percent), there were only three occasions and these are too rare.
トレンドラインについては、2012年末に紹介しております。
分析手法について・その3・トレンドライン編(1)(2012/12/31)
分析手法について・その4・トレンドライン編(2)(2013/01/01)
トレンドラインは裁量の入る余地が大きい手法ですが、現時点で最良と思われる手法と注意点について、述べています。
We introduced our trend line method at the end of 2012.
Our analyzing method Part.3; Trend line method Part 1. (12/31/2012)
Our analyzing method Part.4; Trend line method Part 2. (01/01/2013)
Trend line method has a tendency of making our discretion and we suggested the best method of avoiding our discretion.
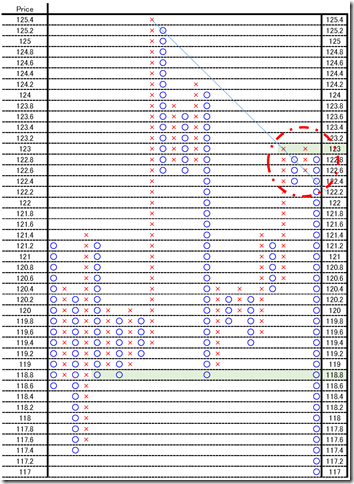
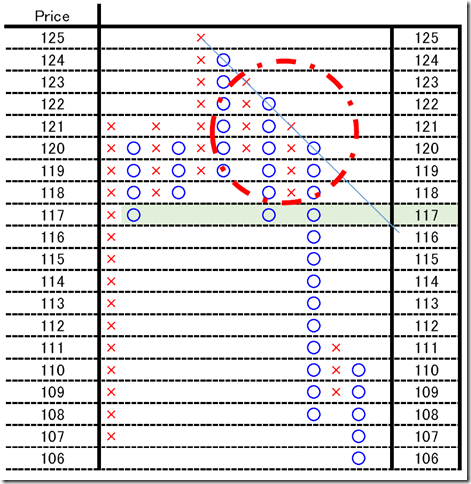
P&Fは、そもそも値幅のノイズを省く優れた分析方法ですが、設定値幅を調整することで、見方が大きく変わってきます。
例えば、週足のドル円相場。
通常使う1円値幅では45度線が利いていますが、0.2円値幅ではダマシとなっています。
それであっても、ぐうの音も出ないような分析としては、最良の方法であり、一貫して相場を観察するには最良の方法だと思っています。
Closed price P&F is the one of the best method free from our discretion and we have only to adjust the price range.
For example, we can introduce the USDJPY weekly market.
We can know 45 degree line worked well in 1.0 yen price range but 0.2 yen price range did not work well.
We can only adjust the price range and we think this is one of the most un-discretional method.
相場分析のリクエストがありましたら“Contact Us”からお知らせください。ご要望にお応えできるように努力いたします。
このブログはあくまでも個人的な見解であり、投資判断は各自でお願い致します。当ブログは一切の投資損益に対する責任を負いません。
ホームページに来て下さってありがとうございます。明日もよろしくお願いいたします。
If you have some request to analyze, please write to “Contact Us”.
We do best effort for your request.
These are only personal opinions on this blog, and you need the investment judgment in each one. This blog doesn’t assume the responsibility to all the investment profit and loss.
Thank for watching our contents. My best regards next day.
如果您需要行情分析,请点击“Contact Us”联系我们。我们将尽力满足您的要求。
本博客仅为个人意见,请各自做出投资判断。本博客概不对任何投资盈亏负责。
感谢您访问本博客。欢迎再次使用。


