日経平均日足短期・2016/12/2でピークアウト??・変化日2016/11/21、2016/12/2
NIKKEI 225 daily short term view; this market may be peaked out in 12/02/2016? ; “HENKABI” are 11/21/2016 and 12/02/2016.
日经225。这个市场可能在2016年2月12号达到顶峰啊?“变化日”是2016年11月21号和2016年12月2号。
本日は日経225超短期日足についてです。
結論は「持ち合うまで仕掛けづらい・変化日2016/11/21、2016/12/2」です。
何度も登場の2016/01/09のレポート「日経平均年足の分析(3)・年初第一週のパフォーマンス分析・年後半は落っこちる系か?」とでは、「今年であれば17697.96円。この値段を心に刻みたいと思います。」と報告しています。
冬休みをはやめにとり、落ち着いてから仕掛けても、チャンスはあるとみています。
Today is about N225 daily.
Our conclusion is “Difficult to entry until becoming steadiness; “HENKABI” are 11/21/2016 and 12/02/2016”.
Our often quoted report “NIKKEI 225 annual No.3; the performance of the first week analysis; Later in this year may be falling” in 01/09/2016 says “This is 17697.96 yen in this year. We need to remind it”.
It may be better taking early winter vacation and waiting for calm market.
日柄のレポートは復習つきで解説していきます。
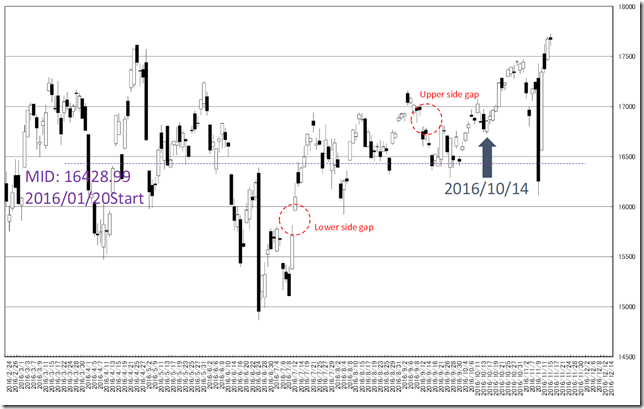
2016/09/28のレポートでは「結論は2016/10/14の変化日に注目です。今のところは下臭さ満点ですが、16000円台ミドルから離れるタイミングに注目です。」としていました。
また、「下の窓を埋められず上昇に転じ、上の窓を残し下方に転じています。埋めたほうがトレンドになりやすいとみています。」とも述べています。
「2016/10/14の変化日」は押しを捕らえていました。
We review our past “HIGARA” report in any time.
And we also referred “Upper and lower side worked as support and resistance. First burying gap will often become trend direction”.
10/14/2016 was a major dip.
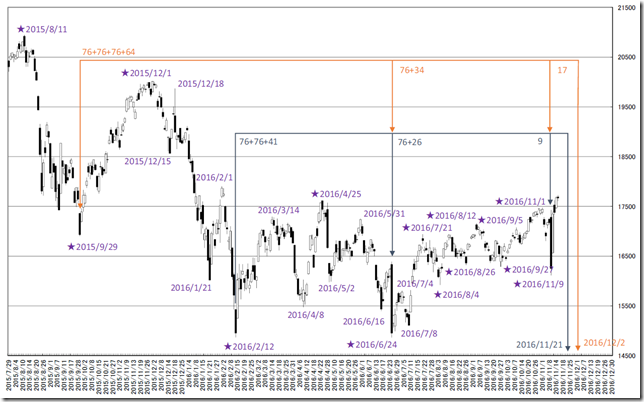
メジャーな頂点からの変化日の位置です。
図中で示す通り、2016/11/21、2016/12/2が注目の変化日です。
大きな値動きからの9手、17手は要注意の日柄になります。
This is the “HENKABI” from the major peaks.
11/21/2016 and 12/2/2016 will become “HENKABI”.
9 business days and 17 business days from big price movement often become “HENKABI”.
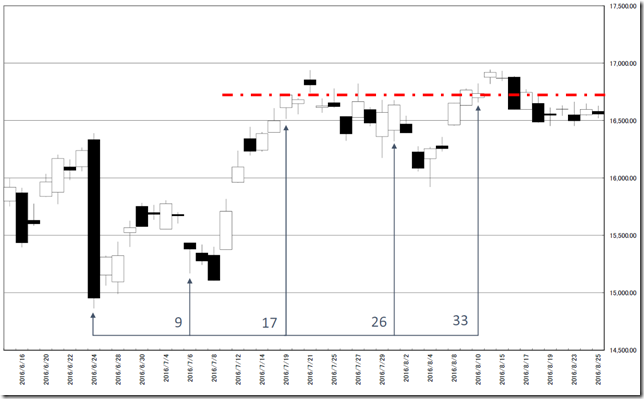
参考になるのは2016/06/24です。
9手で押しの近傍、17手で終値高値です。
2匹目のドジョウパターンなら、これに倣うはずです。
しかしながら、現在はハラミから離れているため、確証が持てません。
The most referenced pattern was 06/24/2016.
9 business days was dipped point around and 17 business days was the highest in close price.
The latest market price may follow this pattern.
But the latest market was launched from the steadiness and we cannot make confidence.
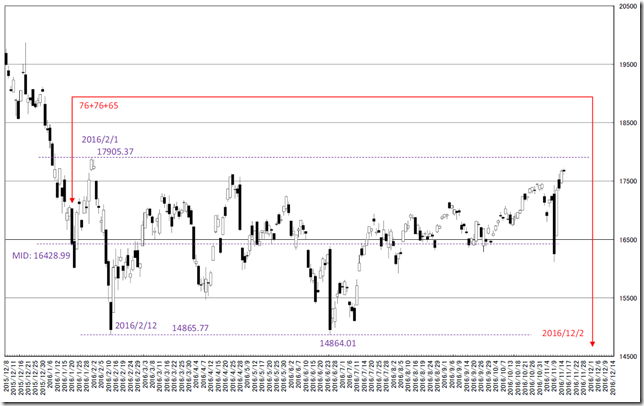
2016/01/20基点持ち合いからの変化日の位置です。
76+76+65手は2016/12/2です。
This is the “HENKABI” point from 1/20/2016 steadiness starting.
76+76+65 business day is 12/2/2016.
相場分析のリクエストがありましたら“Contact Us”からお知らせください。ご要望にお応えできるように努力いたします。
このブログはあくまでも個人的な見解であり、投資判断は各自でお願い致します。当ブログは一切の投資損益に対する責任を負いません。
ホームページに来て下さってありがとうございます。明日もよろしくお願いいたします。
If you have some request to analyze, please write to “Contact Us”.
We do best effort for your request.
These are only personal opinions on this blog, and you need the investment judgment in each one. This blog doesn’t assume the responsibility to all the investment profit and loss.
Thank for watching our contents. My best regards next day.
如果您需要行情分析,请点击“Contact Us”联系我们。我们将尽力满足您的要求。
本博客仅为个人意见,请各自做出投资判断。本博客概不对任何投资盈亏负责。
感谢您访问本博客。欢迎再次使用。


