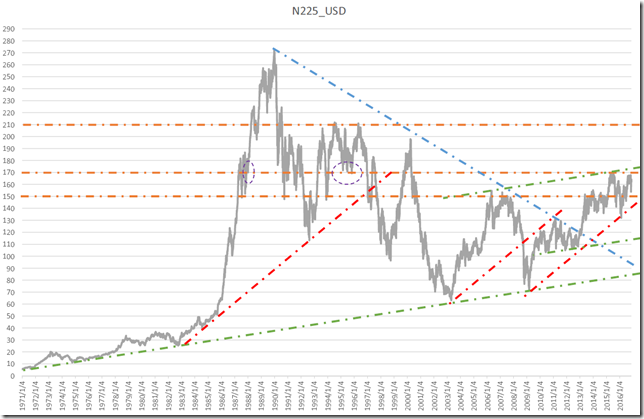
ドルベース日経225長期・値段の節は170ドル、210ドル・黒鳥がくると80ドル付近のイメージ
Dollar based NIKKEI 225 long term; Historically major resistance points are 170 and 210 dollar around; major support is 80 point around.
美元换算的日经225。历史上主要阻力点是170美元和210美元左右。主要支持是80点左右。
ドルベース日経平均は、ピークアウト感満点です。
一般にドルベース日経平均には、150ドルに壁があると言われますが(2015/8/26のレポート参照)、歴史的には170ドルと210ドルの壁があることを紹介します。
Dollar based NIKKEI 225 may be peaked out gradually.
In general, N225 has major resistance point at 150 point around (See 8/26/2016 report) and additionally, there are historical resistance points at 170 and 210 dollar around.
現在の日経平均は緑に挟まれチャネリングしています。
チャネリング中なら上方向のレジスタンスに届きそうですが、上限に届かずにいます。170ドル手前に壁(オレンジ)が出現しており、上方向へ行かせてくれません。
過去にも170ドルはサポートとして機能した地点(紫)であり、納得の値段の節です。
現在の上昇相場を支えているのは140ドル付近に位置している赤のラインです。
バブルの時は、ワンタッチ後に切れてきました。(B地点)
また、ブラックスワンが来ると80ドル近辺が目標になります。
現在の値の半値付近であり、いい感じです。
The latest price is channeling between green lines.
The latest price could not reach the upper side limit.
And 170 point around worked as the resistance point (Orange) and this seems to work strong.
In past market, 170 point worked as resistance and support point (Purple circle) and this is reasonable resistance point.
The latest support line is red line and it exists 140 dollar around.
At “B” point, the market price touched once and felled.
When a black swan will come the most outer support is 80 dollar around.
This is the half price of the latest and this will be proper support.
一番気になったのは、過去の210ドル付近の値動きです。
1994年と1996年に天井を打ち、下落となりました。
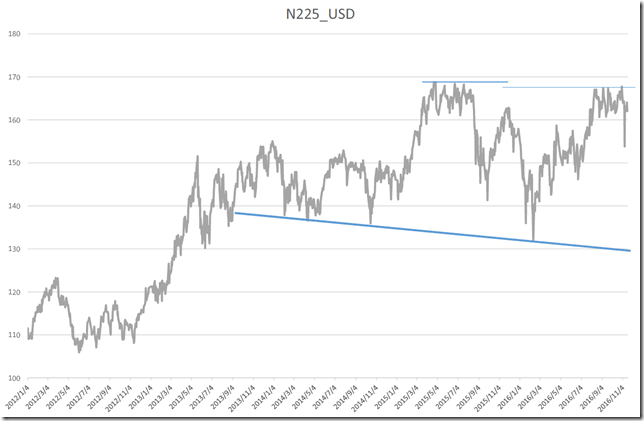
現在の相場も約1年半の間、新高値をつけていません。
過去をなぞるのでしょうか?
The most notable point is 210 point around.
The market price peaked out in 1994 and 1996.
In the latest market, the price cannot take new high for one year and a half.
This market may follow the past.
2016/11/08のレポートでは「ドルベース日経225日足P&F・新高値をつけなければ、ダウ理論通りの下落か?」と報告しています。
終値チャートでもこの傾向はハッキリしており、サポート側も下値を切り下げています。
「さあ買うぞ」と言えるチャートフェースにはみえません。
This tendency is clear in close price chart and the support point is going lower and lower.
We will not to be bullish from this chart face.
相場分析のリクエストがありましたら“Contact Us”からお知らせください。ご要望にお応えできるように努力いたします。
このブログはあくまでも個人的な見解であり、投資判断は各自でお願い致します。当ブログは一切の投資損益に対する責任を負いません。
ホームページに来て下さってありがとうございます。明日もよろしくお願いいたします。
If you have some request to analyze, please write to “Contact Us”.
We do best effort for your request.
These are only personal opinions on this blog, and you need the investment judgment in each one. This blog doesn’t assume the responsibility to all the investment profit and loss.
Thank for watching our contents. My best regards next day.
如果您需要行情分析,请点击“Contact Us”联系我们。我们将尽力满足您的要求。
本博客仅为个人意见,请各自做出投资判断。本博客概不对任何投资盈亏负责。
感谢您访问本博客。欢迎再次使用。


