日経平均年足の分析(2)・2017年末引け値20000円超っていうのは、かなりハードルが高い
NIKKEI 225 annual No.2; 20000yen over in 2017 close price will be difficult.
日经225。年K的分析。(2)。在2017年的收盘价,收盘价2万日元是困难。
本日は日経平均年足についてです。
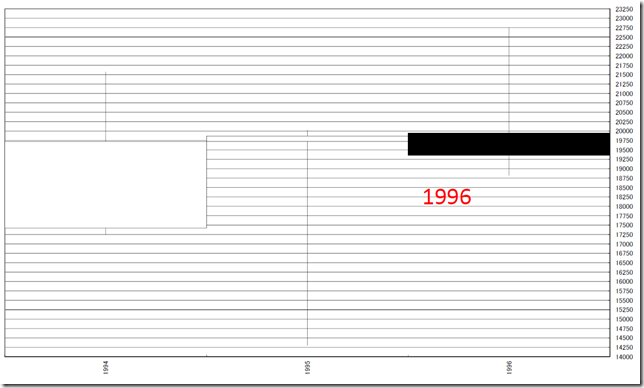
結論は「1996年に既視感。20000円台は一瞬臭い」。
逆に20000円を大幅に超えた引け値となるなら、バブルに期待できます。
それにしても1996年のチャートと2017年のチャートは似ている気がしてなりません。
Today is about N225 yearly.
Our conclusion is 1996 market is déjà vu and 20000yen over will be for an instant.
On the other hand, if the close price in 2017 will be far over from 20000yen, we can expect popping a bubble.
In any way, 1996 chart and 2017 chart is very similar in price range and formation.
はじめに日経平均の特徴を確認します。
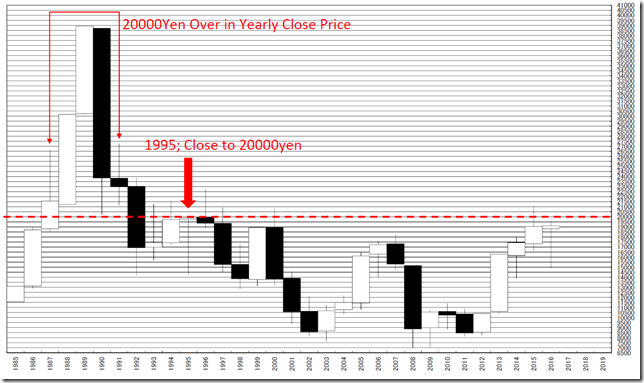
1950年以降、終値20000円台を維持できたのはたった5年しかありませんでした。
つまり、「掉尾の一振」などと言っても、年末に20000円超を維持することは厳しいと意識する必要があります。
First, we confirm N225 unique character.
After 1950, there are only 5 years keeping 20000yen over in close price.
After all, many people quote Japanese saying, “TOUBI NO ISSIN” (At end of the year goes higher) but 20000yen over in close price is difficult.
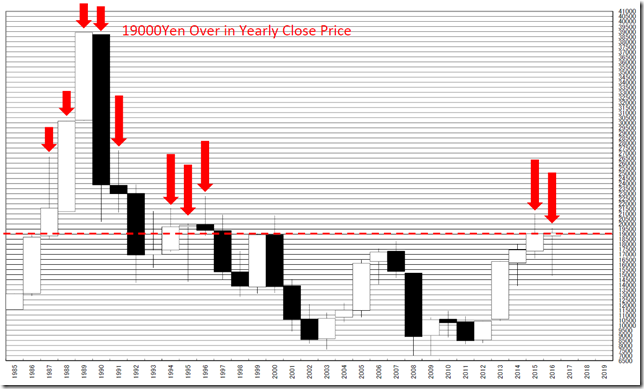
バブル期を除き、19000円台を維持した引け値の維持は厳しかったようで、過去に1994、1995、1996、2015、2016年しかありません。
Excepting bubble zone, 19000yen over in close price is also difficult and they are 1994, 1995, 1996, 2015 and 2016.
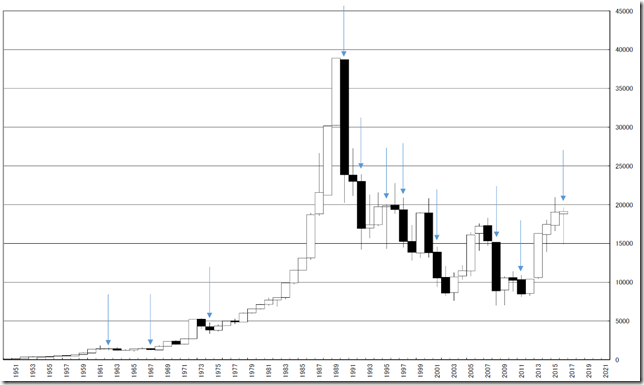
さて、2016年のもう一点の特徴は「2015年高値を超えられず、2015年安値を割り込む」です。
1950年以降、そういった地点に印を入れています。
なかでも、前年の終値付近でオワッタ、1995年、1962年は似ているのか、翌年のろうそく足に特徴がみられます。
And another unique character in 2016 was “Cannot cut the highest in 2015 and cut the lowest in 2015”.
We arrow these points after 1950.
Especially, 1995 and 1962 have similar candle stick character in next year.
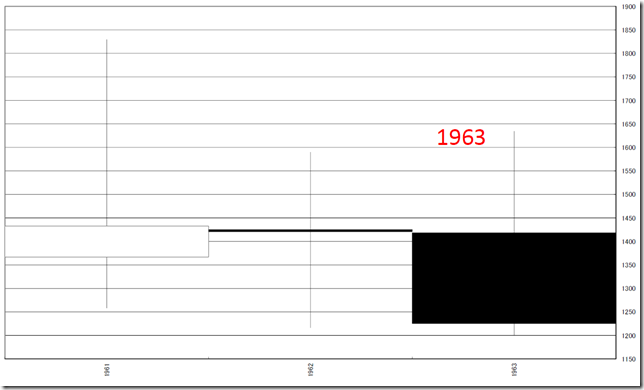
1963年、1996年の共通の特徴というのは以下です。
1. 陰線を引いた。
2. 今年の高値は抜いたが、売り場だった。
3. 終値は前年寄り付きより下だった。
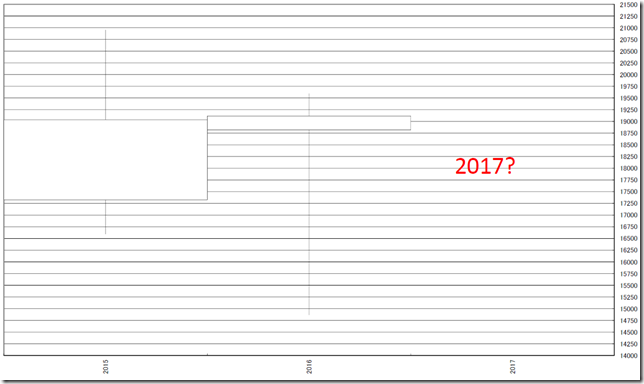
今年の相場に当てはめると、以下の条件になるとみています。
1. 19592.9円を超える。しかし、それ以上なら売り場。
2. 2017年終値は18818.58円を下回る。
The unique characters in 1996 and 1963 are under these.
1. They formed black candle stick.
2. Cutting the highest in last year but it was great selling point.
3. The yearly close price was lower than last year.
Applying to this to 2017, this year’s conditions are under these.
1. The price will going over 19592.9yen but it will be good selling point.
2. The yearly close price will be lower than 18818.58yen.
<2017>
<1996>
<1963>
相場分析のリクエストがありましたら“Contact Us”からお知らせください。ご要望にお応えできるように努力いたします。
このブログはあくまでも個人的な見解であり、投資判断は各自でお願い致します。当ブログは一切の投資損益に対する責任を負いません。
ホームページに来て下さってありがとうございます。明日もよろしくお願いいたします。
If you have some request to analyze, please write to “Contact Us”.
We do best effort for your request.
These are only personal opinions on this blog, and you need the investment judgment in each one. This blog doesn’t assume the responsibility to all the investment profit and loss.
Thank for watching our contents. My best regards next day.
如果您需要行情分析,请点击“Contact Us”联系我们。我们将尽力满足您的要求。
本博客仅为个人意见,请各自做出投资判断。本博客概不对任何投资盈亏负责。
感谢您访问本博客。欢迎再次使用。

