日経平均年足の分析(1)・5年連続陽線は1982年以来・違いは新高値をとらなかったこと
NIKKEI 225 annual No.1; 5 years continuous white candle sticks is similar to 1982 market and the difference is not taking new high.
日经225。年K的分析。(1)。5年连续白蜡烛棒类似于1982年市场,但是差别不是新的高。
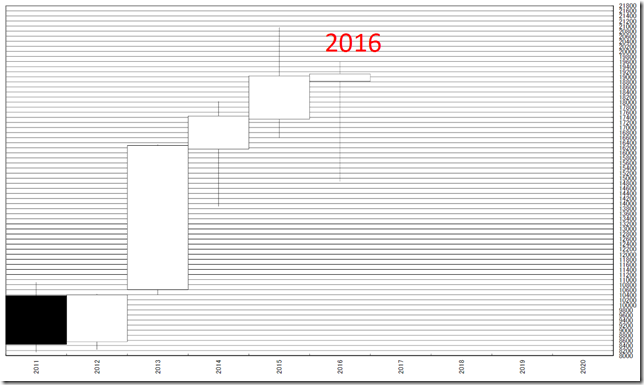
日経平均の年足は5年連続陽線となりました。
結論は「今年は踊り場」か?
Nikkei 225 became 5 years continuous white candle sticks.
Our conclusion is this year seems to be watershed.
言いっぱなしというのは、よくありません。
昨年の分析の反省会です。
2016/1/6の分析では「日経平均年足の分析(2)・4連騰の後は長い下ヒゲ、または下落?」と報告しています。
2016/1/9の分析では「日経平均年足の分析(3)・年初第一週のパフォーマンス分析・年後半は落っこちる系か?」と報告しています。
2016/7/2の分析では「日経平均年足の分析(4)・年足は陰線の可能性高まる」と報告しています。
上記のレポートの中で重要な部分だったのは以下です。
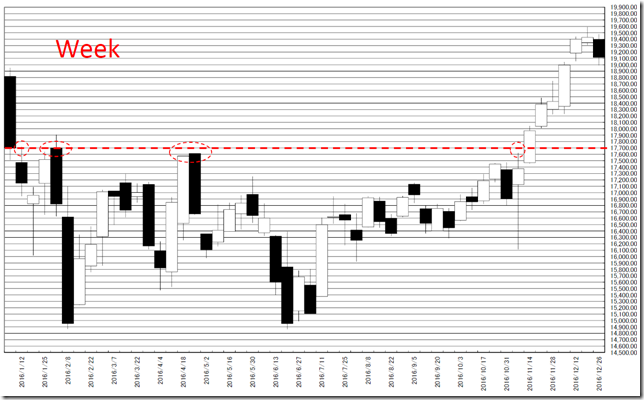
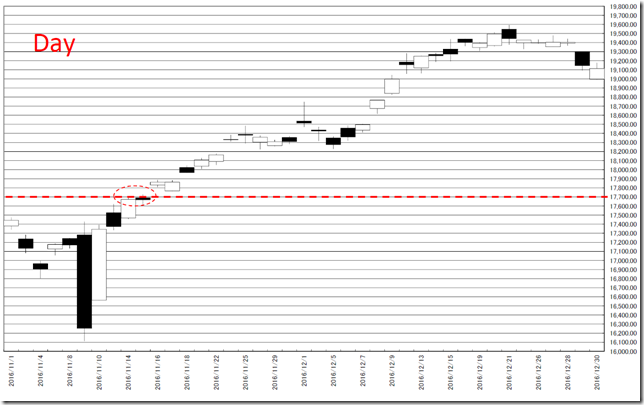
「年初第一週の引け値(オレンジの線)を巡る攻防が今後発生するということです。今年であれば17697.96円。この値段を心に刻みたいと思います。」(2016/01/09レポート参照)
心に刻めたかたは、Opportunityを満喫できたと思います。
Analysis needs reviewing and we need!
Reviewing our report.
On these reports, the most important point was under these.
If you can remind the meaning of 17697.96 yen, you might take good opportunity in last year.
さて、昨年は5年連続の陽線となりました。
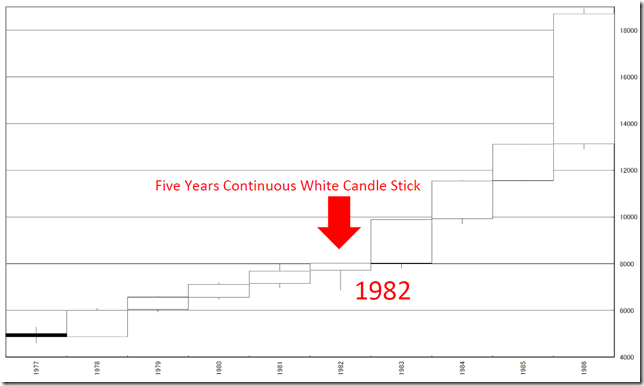
1950年以降、5年連続の陽線は1982年だけです。
「このままバブルじゃい、HAPPY」と思いたいのですが、新高値をとらなかった違いもあります。
2016 candle stick formed 5 years continuous white.
After 1950, this occasion occurred since 1982.
We may think “A bubble pop and we will be happy” but there was a great difference; a new high was not taken.
<2016>
<1982>
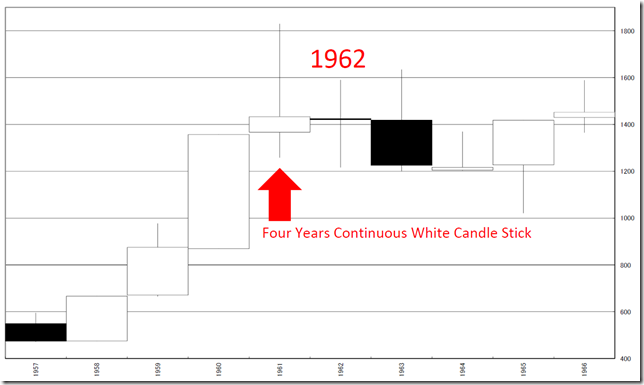
むしろ1962年相場の方が似ています。
4年連続陽線の後、実体が同時線みたいである点、新高値は1960年だった点はソックリです。
Rather than, this market is similar to 1962 market.
After taking 4 years continuous white candle stick, the price formed “Open and Close price was very close”.
And taking new high was 1960.
<1962>
相場分析のリクエストがありましたら“Contact Us”からお知らせください。ご要望にお応えできるように努力いたします。
このブログはあくまでも個人的な見解であり、投資判断は各自でお願い致します。当ブログは一切の投資損益に対する責任を負いません。
ホームページに来て下さってありがとうございます。明日もよろしくお願いいたします。
If you have some request to analyze, please write to “Contact Us”.
We do best effort for your request.
These are only personal opinions on this blog, and you need the investment judgment in each one. This blog doesn’t assume the responsibility to all the investment profit and loss.
Thank for watching our contents. My best regards next day.
如果您需要行情分析,请点击“Contact Us”联系我们。我们将尽力满足您的要求。
本博客仅为个人意见,请各自做出投资判断。本博客概不对任何投资盈亏负责。
感谢您访问本博客。欢迎再次使用。

